
Market Basket Analysis 101: Anticipating Customer Behavior
In the business world, “market basket analysis” helps retailers better understand – and ultimately serve – their customers by predicting their purchasing behaviors. Applied to consumers as recommendation systems, market basket analysis is the most common form of artificial intelligence consumers encounter. We’ll explain how market basket analysis works and what it takes to deploy a market analysis solution.
Market basket analysis (MBA) is a data mining technique that is used to uncover purchase patterns in any retail setting. MBA is a set of statistical affinity calculations that help business leaders better understand – and ultimately serve – their customers by highlighting purchasing patterns. In simplest terms, MBA looks for what combinations of products most frequently occur together in transactions. These relationships can be used to increase profitability through cross-selling, recommendations, promotions, or even the placement of items on a menu or in a store.
The approach is based on the theory that customers who buy a certain item (or group of items) are more likely to buy another specific item (or group of items). For example: while at a quick-serve restaurant (QSR), if someone buys a sandwich and cookies, they are more likely to buy a drink than someone who did not buy a sandwich. This correlation becomes more valuable if it is shown to be stronger than that between the sandwich and drink without the cookies.
MBA can be used to recommend a purchase based on the absence of a common pairing, such as when a customer at a QSR orders only a small sandwich. They might be more likely to buy a dessert or a second sandwich than someone who bought a large sandwich. Staff trained to recognize these situations can offer their customers the additional items, possibly with a discount to make the option more attractive.

Applied more deeply, MBA allows companies to identify the keystone products, those that differentiate them in the market and could potentially hurt business if they were unavailable or more expensive. Gourmet or other specialty items in a grocery store might have limited appeal, but the customers they attract (and their subsequent spending) could justify high-visibility placement. Customers ordering through the company’s app could be interested in items or combinations that offer extra loyalty points.
Generating reliable insights from MBA typically requires large volumes of transactional data. Large data sets are difficult to process without highly-scalable storage and compute resources. Modern cloud-based architectures allow for more agile data mining and analytics with the capability to test a number of theories of customer behavior or to examine the effectiveness of a recent marketing campaign. Smartbridge clients are using Microsoft Azure with Microsoft Synapse or Snowflake as a data lake with analytic tools like Power BI, integrated with Python or specialized R statistical packages, to solve these problems.
Market Basket Analysis, Explained
MBA aims to find relationships and establish patterns across purchases. The relationship is modeled in the form of a conditional algorithm:
IF {sandwich, cookies} THEN {drink}
In the shorthand notation, which translates to “the items on the right are likely to be ordered with the items on the left:”
![]()
A collection of items purchased by a customer is an itemset. The set of items on the left-hand side (sandwich, cookies in the example above) is the antecedent of the rule, while the one to the right (drink) is the consequent. The probability that the antecedent event will occur, i.e., a customer will buy a sandwich and cookies, is the support of the rule. That simply refers to the relative frequency that an itemset appears in transactions. In a QSR, the support of an item or item combination helps to identify keystone products. Hence, if a sandwich and cookies have high support, then they can be priced to attract people to the store.

The probability that a customer will purchase a drink on the condition of purchasing a sandwich and cookies is referred to as the confidence of the rule. Confidence can be used for product placement strategy and increasing profitability. Placing high margin items near associated high confidence (driver) items can increase the overall margin on purchases.
The lift of the rule is the ratio of the support of the left-hand side of the rule (sandwich, cookies) co-occurring with the right-hand side (drink), divided by the probability that the left-hand side and right-hand side co-occur if the two are independent.
Market basket analysts search for rules with lift that are greater than 1 backed with high confidence values and often, high support.
The Apriori algorithm is a commonly-applied technique in computational statistics that identifies itemsets that occur with a support greater than a pre-defined value (frequency) and calculates the confidence of all possible rules based on those itemsets.
Market Basket Analysis Example
The Apriori algorithm is implemented in the arules package, which can be installed and run in R. Data is loaded into the engine in the following format:
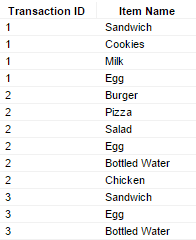
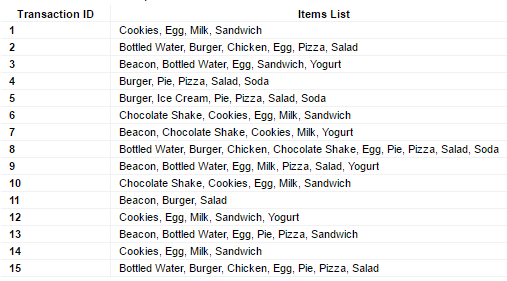
The first column is the order/transaction number and the second is the item name or, more often, the item ID. The next steps usually involve aggregating each transaction across records into a single record as an array and converting the dataset to an R transaction. The result of that aggregation is as shown below:
Finally, the Apriori logic is applied to the transactions with the following resultset:
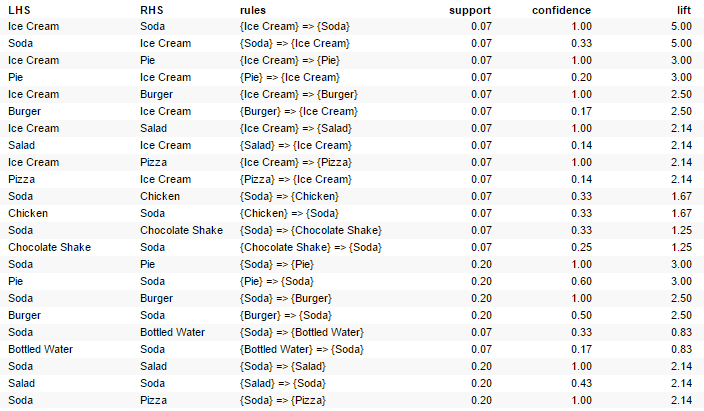
Overall, we see a number of strong consequent (RHS) combinations with soda, which could indicate that soda is a keystone product category. A manager could decide to keep the price and margins low on soda to drive sales volume. Bottled water is the exception, but we can assume that those would be considered alternatives to each other.
Perhaps a more interesting result is that all of the rules with ice cream show significant lift with a confidence of 1. (Associations in the other direction aren’t nearly as likely.) This could lead us to further promote ice cream with the expectation that customers will purchase other items at the same time.
Other Uses for Market Basket Analysis
In addition its popularity as a retailer’s technique, MBA is applicable in many other areas:
More and more organizations are discovering ways of using market basket analysis to gain useful insights into associations and hidden relationships. As industry leaders continue to explore the technique’s value, a predictive version of market basket analysis is making in-roads across many sectors in an effort to identify sequential purchases.
Looking for more on data & analytics?
Explore more insights and expertise at Smartbridge.com/data
There’s more to explore at Smartbridge.com!
Sign up to be notified when we publish articles, news, videos and more!
Other ways to
follow us: