
How to Increase Tableau Dashboard Performance
Through live Tableau data model connections, data retrieval is intended to perform at real-time speed. However, what course of action can be taken if the dashboard takes too long to process? Through a real client experience, Consultant Lahari Sattiraju explains how her team overcame this obstacle and the process of how to increase Tableau dashboard performance.
The Client’s Challenges
Our team was developing a set of interactive, real-time dashboards for a well known facilities services client. One of the dashboards was taking 40+ minutes to process and retrieve the results using a live Tableau data model connection. This dashboard was intended for our client’s internal users, who have access to essentially all the data available in the system. This level of access also included our client’s customer users, who only access data related to their specific businesses.
This requirement called for the enforcement of multi-tenancy into the dashboard. This entailed that each time a user logged in, the dashboard had to filter out only the data he/she had been authorized to access. Each time a user logged in, a link of accessible locations and elaborate trail of selected drop-down options were making the underlying SQL query run for an exorbitant time. This was significantly affecting the dashboard’s performance, and rendered a very slow response time. We were faced with two primary challenges with respect to these dashboards:

Just getting started in Tableau? Check out our two-part video series on the fundamentals of Tableau, and how to get started creating your own interactive dashboard.
The Approach and Solution
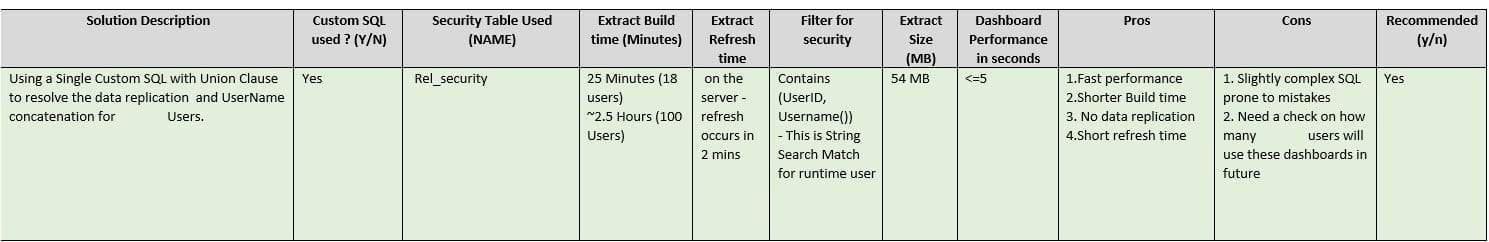
Our team came up with several prospective solutions to handle the Tableau user security and performance optimization requirements. We tried and tested the below options before integrating the final solution:
After carefully weighing the pros and cons, we decided to go with option 3. Additionally, we built a customized SQL query (with string concatenation & union) specifically intended for our dashboard requirements. We also paired it with data source filters, such as restricting the amount of data users could see in a given time period. We then created an extract of this custom SQL.
How to Increase Tableau Dashboard Performance – The Step by Step Process
Step 1:
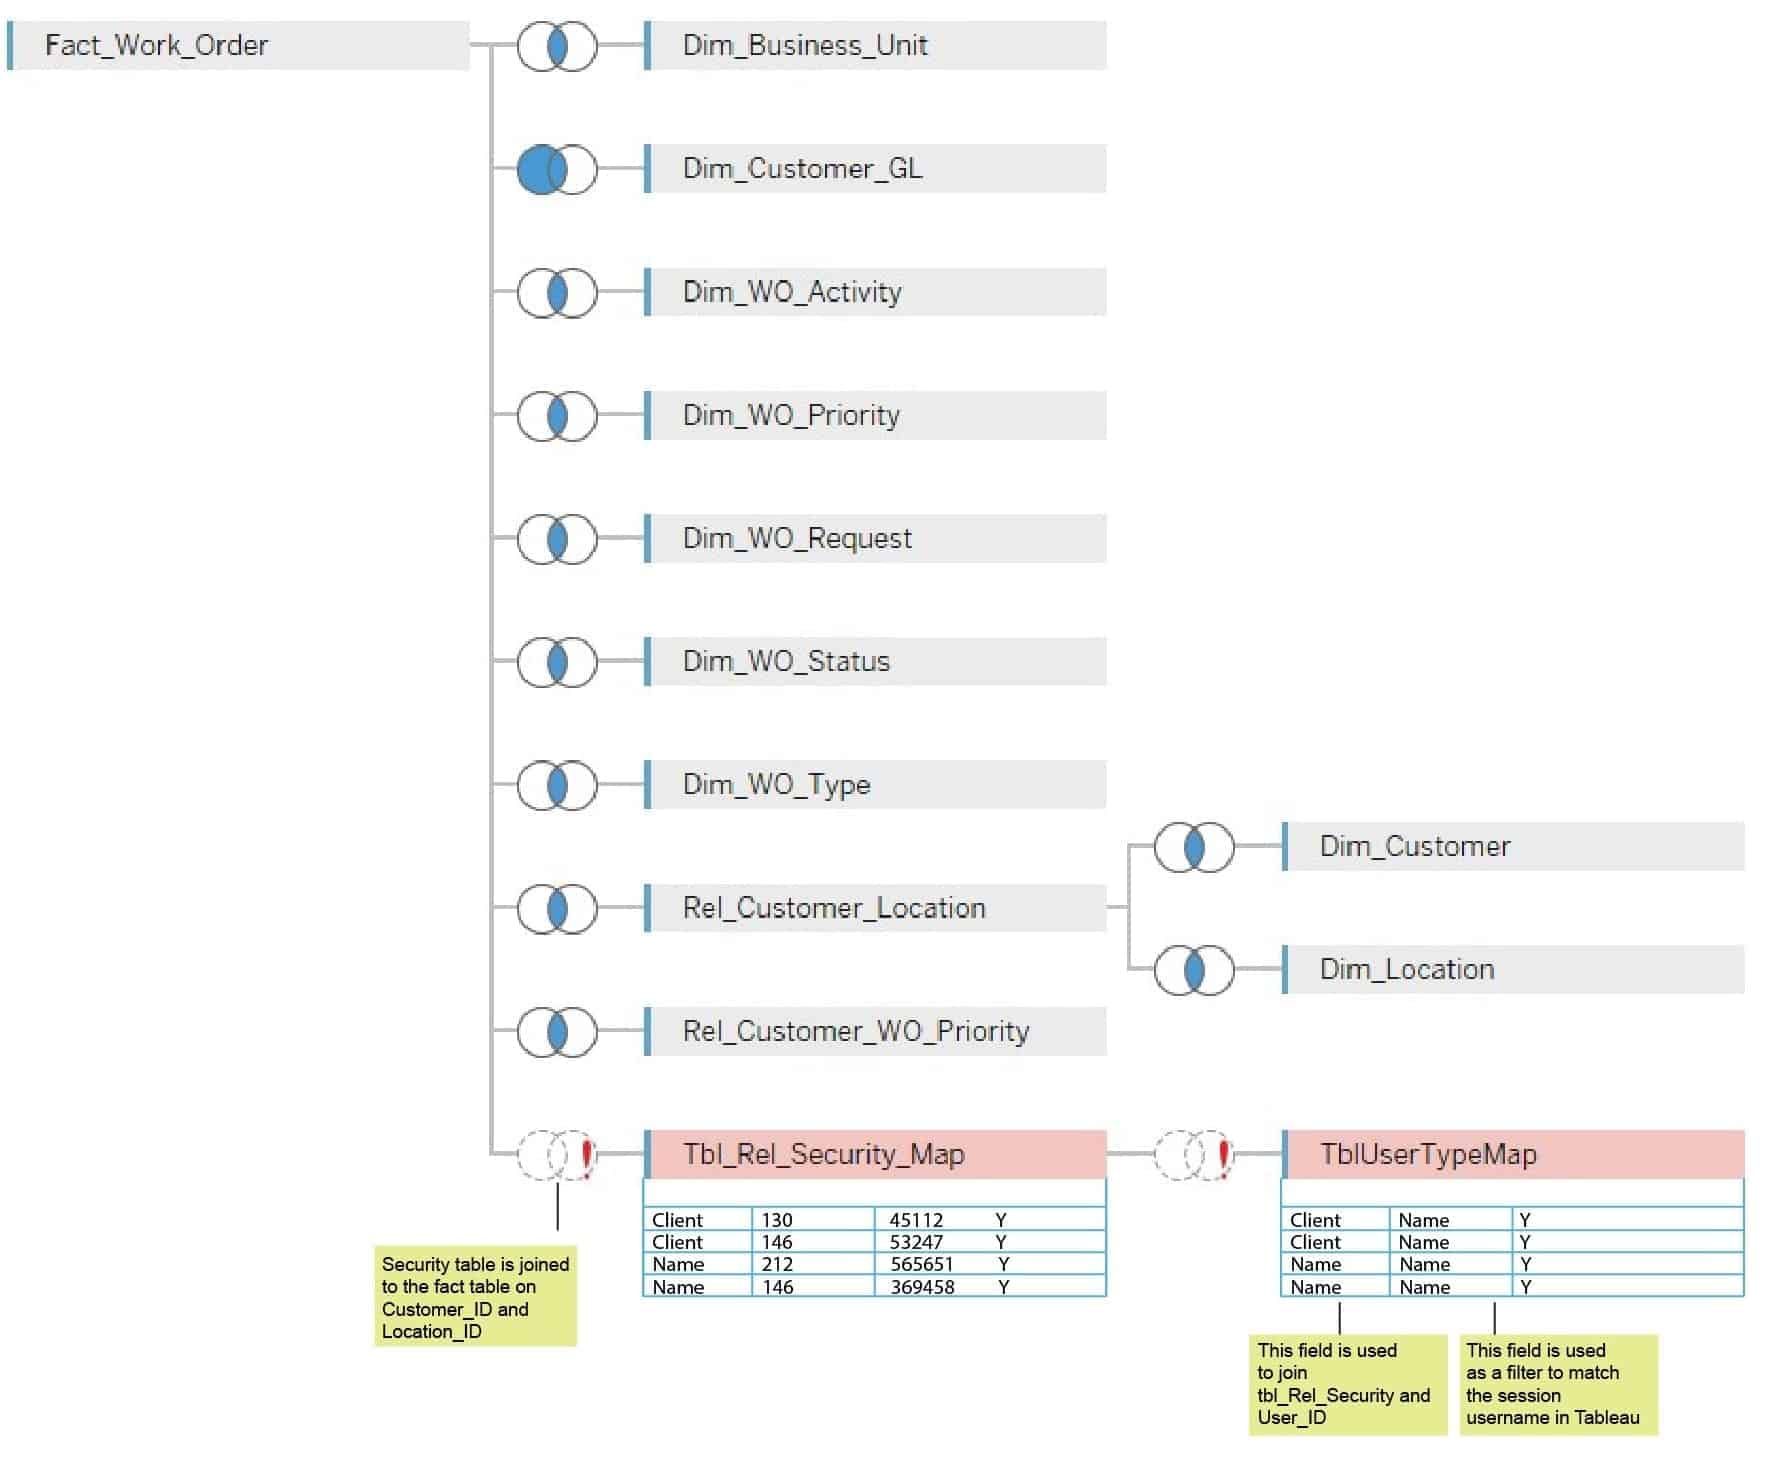
Use two separate tables to resolve the security and data replication problem, discussed in option 3. Below is a user ID mapping table which determines if a user level is customer or global. For global users only, we set the “user_IDE” field to “internal”. This table is filtered by actual user name (User_IDF) in Tableau. The customer user IDs are shown as is.
The second table is a security table (Tbl_Rel_Security). All global users are entered as “internal”, while customer user IDs are still shown as is. This table is joined to the main fact table on ‘customer_ID’ and ‘location_ID’.
Step 2:
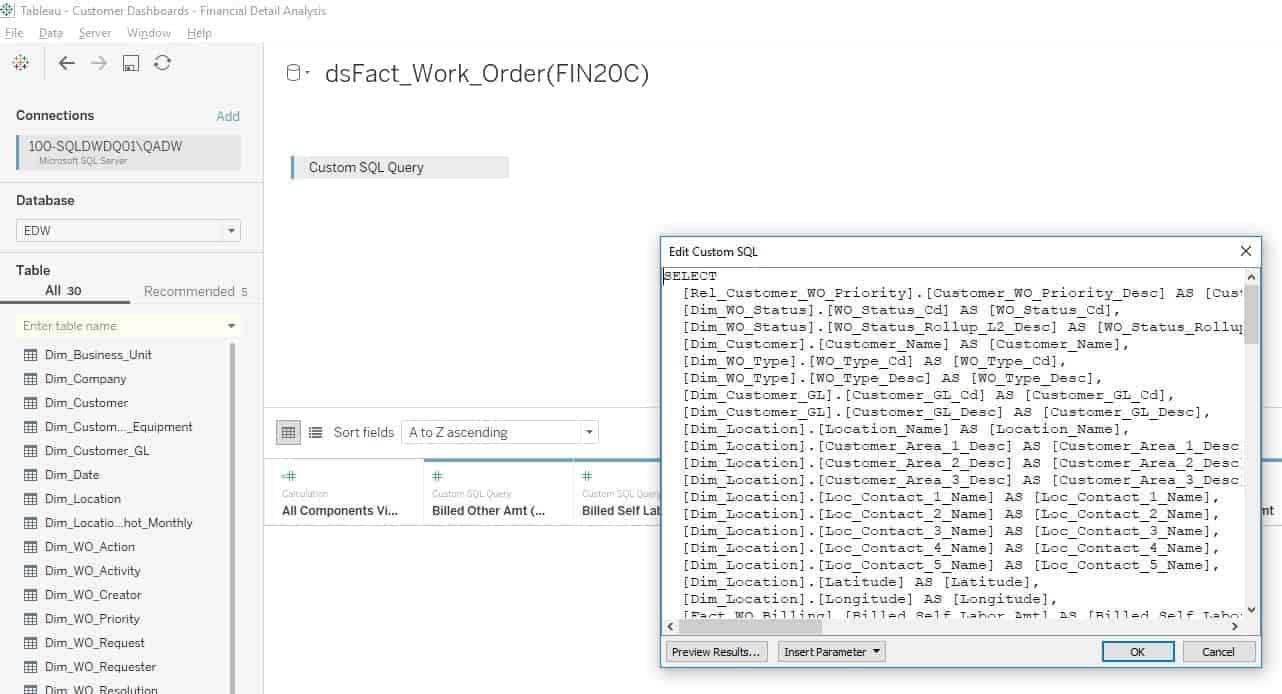
Write and deploy a custom SQL Query (with string concatenation & union) to handle the specific security requirements for each dashboard.
Step 3:
Apply data source level filters.
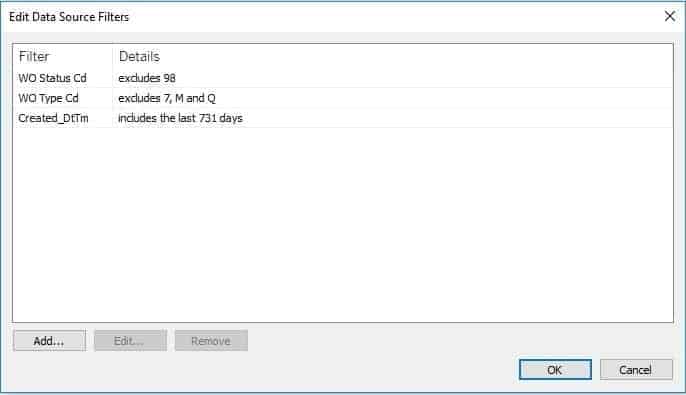
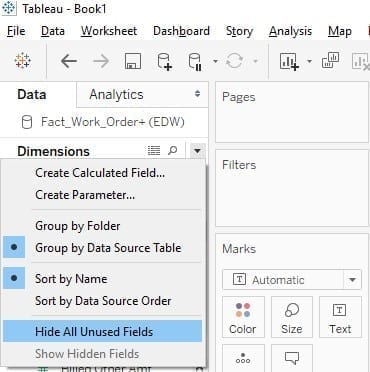
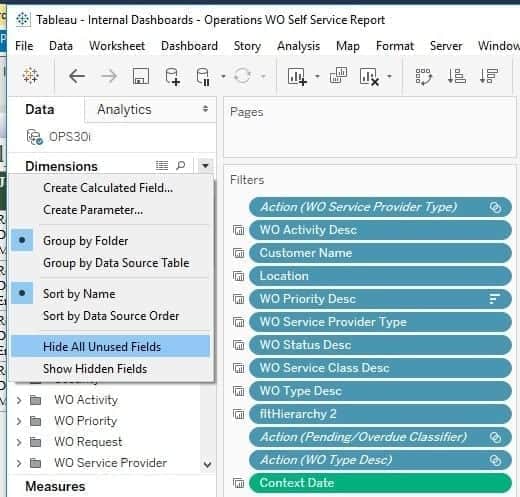
Step 4:
Select the “hide all unused fields” option from Tableau. This will exclude all the unused fields from the extract, while also minimizing the extract refresh time and custom SQL query time.
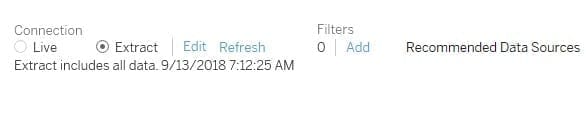
Step 5:
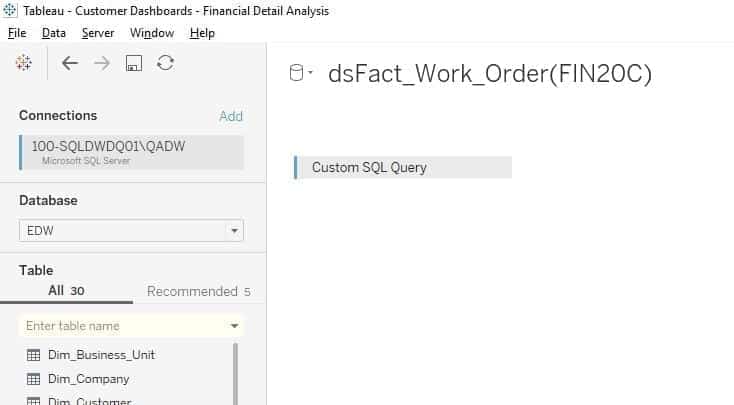
Create the extract from Tableau and set the refresh schedule.
The Results
Below are some of the stats related to the dashboards performance with our solutions now in place.
When published on our test servers, the solution brought down our dashboard response time to under 3 seconds. By detecting this problem in the early stages and tailoring the solution to the situation, we were able to deliver best experience of faster dashboard performance to our client.
There’s more to explore at Smartbridge.com!
Sign up to be notified when we publish articles, news, videos and more!
Other ways to
follow us: