Understanding Changing Customer Preferences in a Pandemic with Market Basket Analysis
The Need for Pandemic-Related Analytics
Our client, a popular institution in the food service industry, owns, operates, and franchises two well-known restaurant brands. These organizations specialize in the operation of fast-casual restaurants, each offering distinct and unique flavors with broad appeal at a compelling value. These restaurant chains practice fresh-made cooking, drive-thru service, and catering.
CLIENT PROFILE
EMPLOYEES: 10,000+
INDUSTRY: Restaurants
HEADQUARTERS: Texas
FOUNDED: 2011
Uncovering Information with Market Basket Analysis
Consumer behaviors have changed as people are learning to live with the new reality of COVID-19. Take-out and delivery orders have increased, and our client has added new products to their menu in response to new customer preferences.
With all the ongoing changes, the client had many unanswered questions such as:
The client already had reports that tracked product sales and operational metrics, however, there was a need to get a deeper insight into product analytics. The client needed to identify what products and presentations were being sold more often, measure the acceptance of new products, and determine what products customers purchase together to improve marketing campaigns, promotions, and sales.
A Four Part Solution
After discussing the requirements with the client, Smartbridge designed four self-service reports that provide the data and information needed to answer their questions.
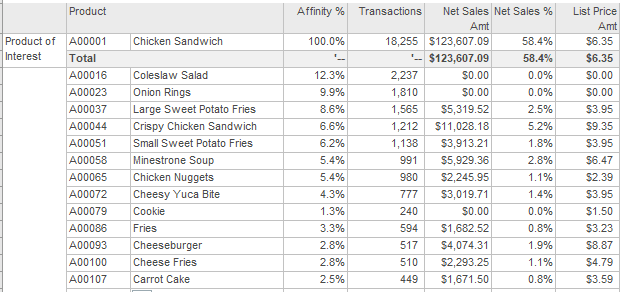
1. Affinity Report
The purpose of this report is to identify the relationships between two products and how often a menu item is sold in conjunction with another. With this report, stakeholders are able to find relationships that are not obvious and make decisions according to the results.

2. Control Group Report
This report tracks operational KPI’s like sales, transactions, and cost by comparing transactions that contain one or several menu items of interest versus the transactions that don’t include those menu items. The purpose of this report is to identify how a combination of menu items contribute to sales, transactions, and costs.
3. Combination Report
This report displays the most common combinations of products to determine what products customers purchase together.
4. Transactions Detail Report
This report contains the details of each transaction such as products sold, quantity, price, sales amount, cashier, discounts, etc. This report is used to answer ad-hoc questions which require more detail.
Success Through Insightful Reporting
The client was able to identify changes and new patterns in products purchased together, track their sales, and identify some regions where they are performing better. The client also ran an analysis in the pre and post COVID period and found some products had unexpected sales growth.
The client also detected the most common product combinations based on the sales channel and used all of this information for marketing and operations decisions.
“Just had a first drill with the new affinity and combination reports… and they are just great. Thank you for developing them for us and for doing such great work.”
There’s more to explore at Smartbridge.com!
Sign up to be notified when we publish articles, news, videos and more!
Other ways to
follow us:


