Reduce Employee Turnover with Data Science
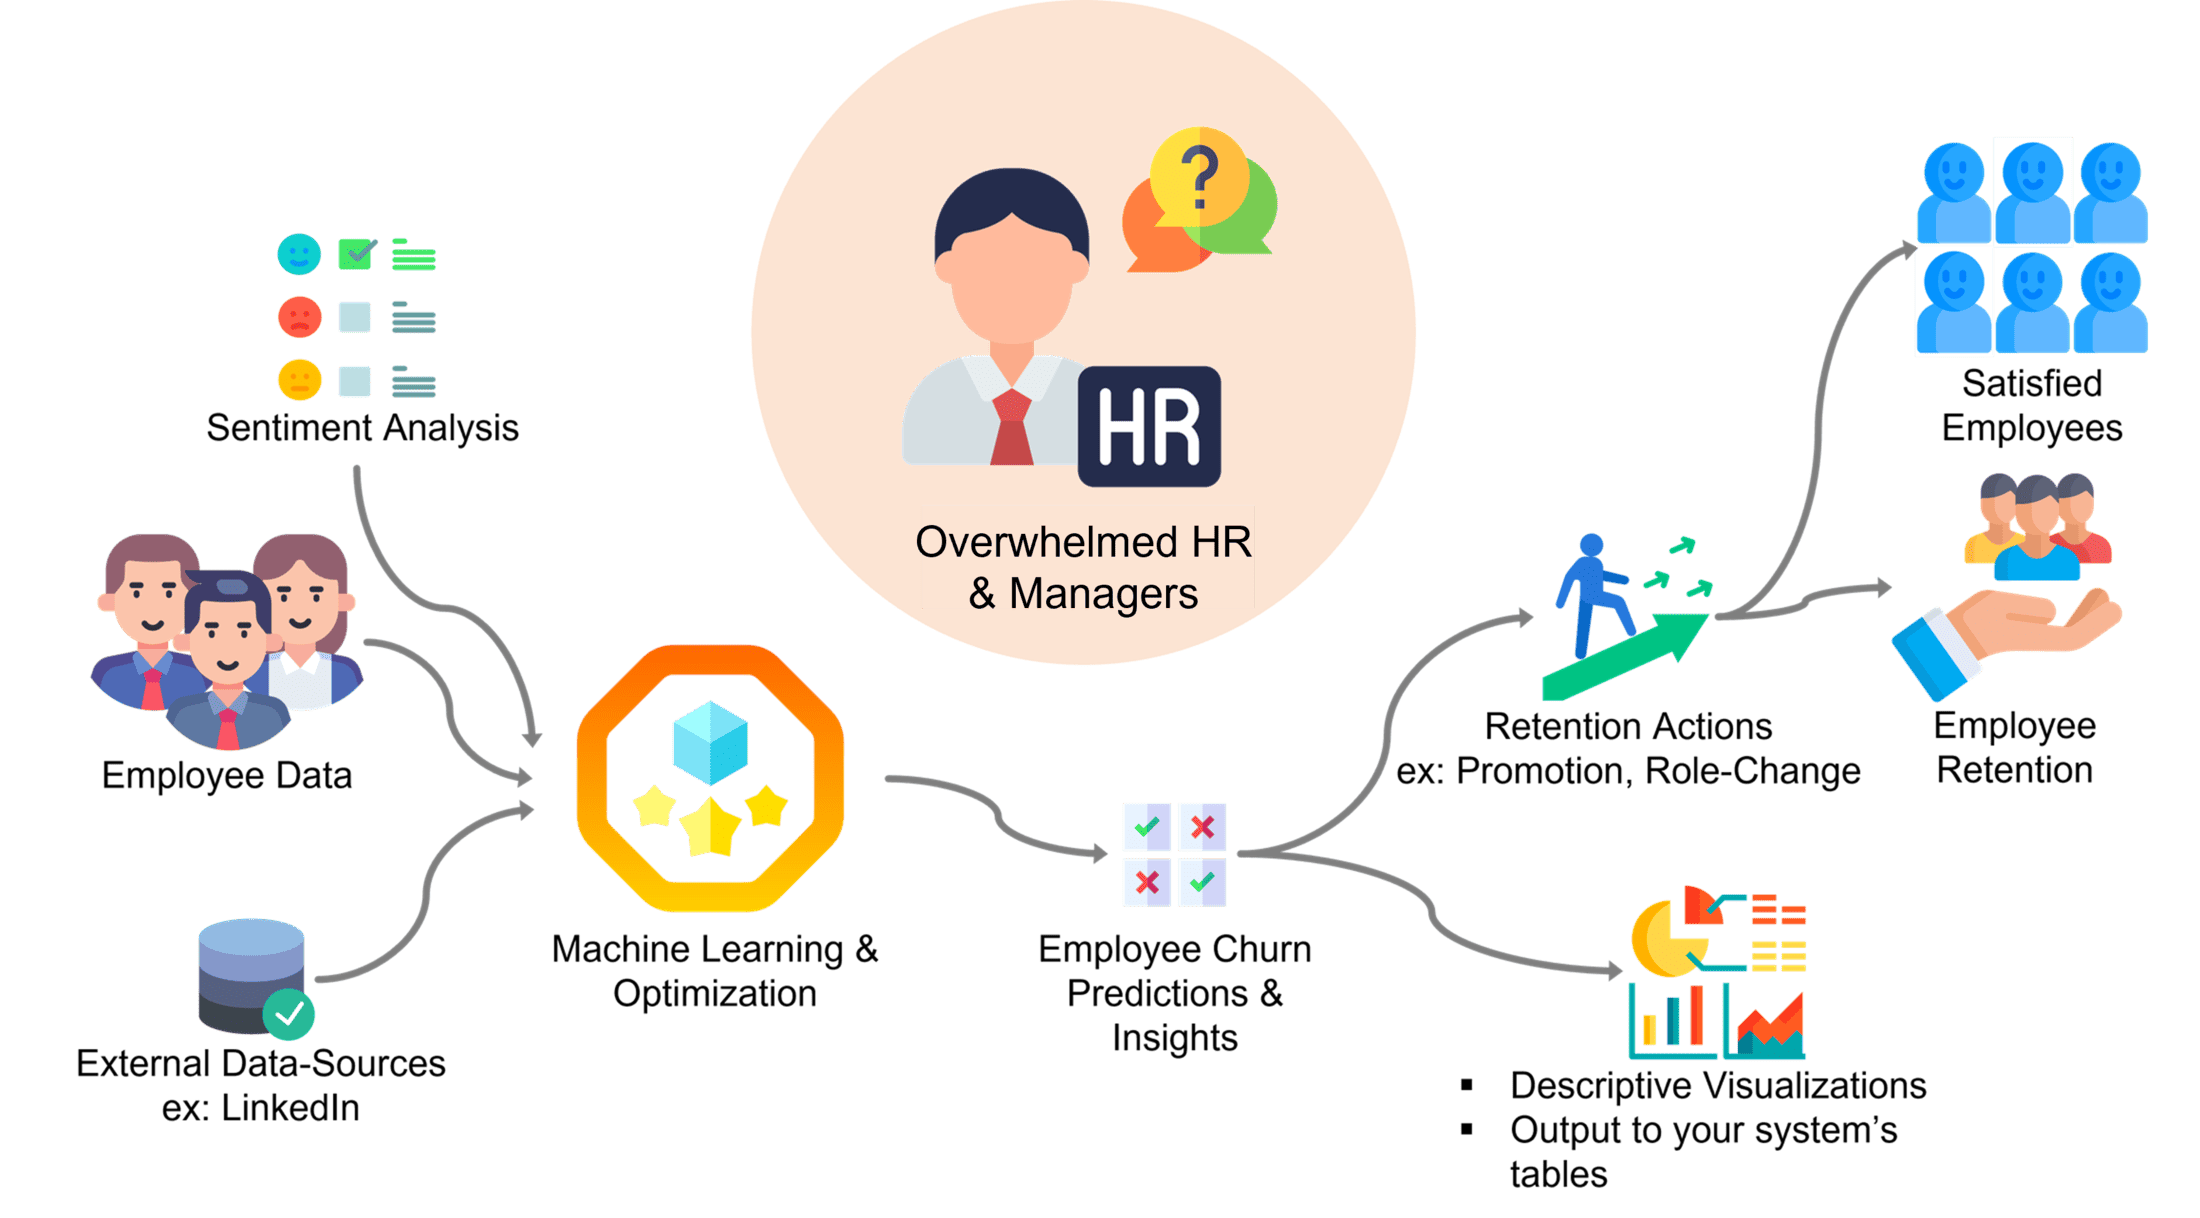
Data science can be applied to many use cases, but one of the most relevant problems facing companies today is reducing employee churn and turnover. To address this, our data science team has determined a model that will help predict which employees are at a higher risk of leaving, so companies can take steps to remedy the situation to retain the talent.
The Challenge
Businesses are struggling with employee resignation. Even worse, managers are often surprised that individuals wanted to leave in the first place. These resignations aren’t trivial; they’re costly. Interviewing costs, training costs, and business-specific knowledge are all lost when an employee quits.
Typically, HR data can have insights into who might leave and why, but this is often tedious to parse out as an analyst with large data sources. In contrast to traditional business intelligence methods, machine learning algorithms have the potential to quickly find patterns that are otherwise difficult for humans to discover and encode, such as patterns of an employee who’s ready to exit their current employer.
Value realization using data and analytics is becoming more common throughout companies across all industries today. An insight-driven approach led by artificial intelligence (AI) and machine learning (ML) can help address more complex questions, even the problem of customer churn.
Smartbridge can help organizations see the risk of employee churn ahead of time, enabling employers to preemptively take retention actions. This foreknowledge has the potential to reduce HR costs, increase retained “tribal knowledge”, and raise employee satisfaction.
To demonstrate this, we will be delving into a use case that deals with HR data such as employee satisfaction levels, average hours worked, and tenure at the company to come to the conclusion of whether an employee will resign or not.

Our Method to Reducing Employee Turnover
The Data
The table below shows the data we used and example values. This data is fairly simple. Most companies can and likely are tracking these metrics. Furthermore, these only represent the beginnings of useful features for deriving the risk of employee churn.
| Feature | Examples |
|---|---|
| Has this employee had a promotion in the previous 5 years? | True, False |
| Previous annual review score | 91%, 63%, 78% |
| Relative employee salary | High, Medium, Low |
| Average monthly hours worked | 200, 310, 156 |
| Current number of projects | 4, 3, 2 |
| Tenure with the company (years) | 3, 10, 1 |
Guiding Metrics
While many problems are common and thus have common solutions, this doesn’t mean we should walk around as hammers thinking each problem is a nail. What guiding metric you choose is consequential and can benefit you more or less.
For example: Even though accuracy is an easy metric to understand, if false negatives (as in employees the model said wouldn’t churn but actually do) aren’t taken into account, it may be especially painful to the business. Instead we might optimize for the recall metric, which takes false negatives into account and intelligently guides your model as such.
However, if no standard metric fits your purpose it may be that your business should use a custom metric, such as one which weighs the costs of retentive actions (say $5,000 / year for a raise) vs. the cost of allowing false negatives to slip through (say $10,000 for a “lost” employee). Even a unique metric like this can be created and used to optimize models for your unique needs.

Our Model for This Case
Smartbridge has created accurate, optimized pilot models within days, but an entire solution can be stood up within a few weeks. In this case, the final model chosen for our purposes and the dataset was a Random Forest Classifier, an ensemble tree-type algorithm. Some other top contenders were the simpler Decision Tree and K-Nearest Neighbors algorithms.
In many instances models perform differently per different metrics, here Random Forest performed best across all relevant metrics. Most notably, it attained the best Recall, and since we’re aiming to minimize false negatives (they hurt more in this context) Recall is the best metric: so Random Forest it is.
| Random Forest | Logistic Regression | |
|---|---|---|
| Accuracy | 98% | 89% |
| AUC | 99% | 93% |
| Recall | 96% | 78% |
Findings
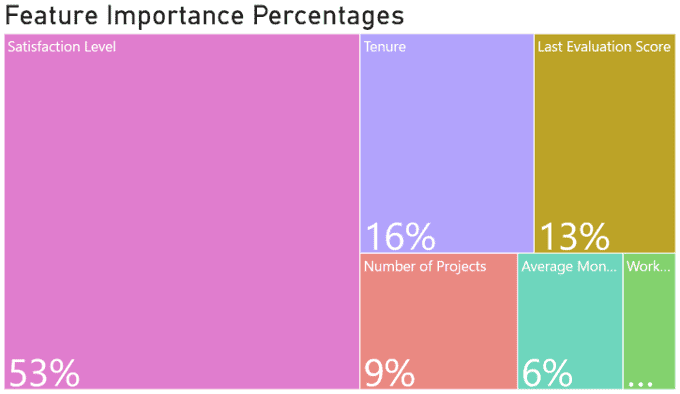
Feature importance of your models helps HR to prioritize what to focus on. These feature importances quantify the predictive power that each feature provides for your model.
For this case the most influential features in descending order were:

While these findings may seem simple, for example: obviously, as satisfaction level decreases the likelihood for an employee to churn increases, writing the rules to produce the actual likelihood of an employee churning and keeping those rules accurate over time is the hard part. The risk of traditional programming is that your rules will be useful one day, but then useless the next, and the cost to pay a person to constantly rediscover the correct rules is much more than an optimized system.
Along with this, these proven ML insights combined with traditional business intelligence can help HR, analysts, or managers dig deeper into focused areas of your data and find more insights. For instance, at 5 years of tenure, the average churn rate for employees is 56% vs. only 29% at 6 years of tenure.
Not just that, feature importance helps HR to prioritize what to focus on when improving employee retention.
Outputs
Actionable Insights
An Adaptive Data Solution
Delivery, Interpretation, Visualizations
Partner Cloud Platforms to Host the Solution

In whatever way your business does IT infrastructure, we have the experience and skill sets to make it work. We can work with other solution providers as needed.
No matter what industry your organization is in, value realization and risk management through data science and insight-driven approaches can make a tremendous difference in the way your company operates. Let Smartbridge help. Our AI/ML experts are here to help you identify opportunities for digital innovation. If you would like to explore this model in your organization, feel free to book a chat with us to see how we can tailor this solution for you.
Keep Reading: A Customer 360 Solution for Insights and Predictions
Looking for more on data science?
Explore more insights and expertise at smartbridge.com/ai/services/data-science-analytics
There’s more to explore at Smartbridge.com!
Sign up to be notified when we publish articles, news, videos and more!
Other ways to
follow us:


