Power BI Governance in Microsoft Fabric
Ensure a Successful Power BI Deployment
In Fabric, Power BI remains the front door to insights. Strong report governance helps your teams manage content growth, improve performance, and maintain trust in every dashboard.
Companies across all industries understand they need improved reporting and analytics that are intelligent, provide improved visuals and drive quicker business insights. Microsoft Power BI is the market leader as it provides flexibility, horsepower, and advanced functionality all at an affordable price point and within a system your organization probably already uses. For those that may not know, Power BI now lives in the unified data platform, Microsoft Fabric.
Even in Fabric’s unified environment, report-level governance plays a critical role. Without structure, organizations face familiar challenges:
Fabric centralizes the data foundation, but users still rely on well-governed, clearly documented reports to make decisions with confidence.
When reports are left unmanaged, different teams may publish their own versions of metrics or build redundant dashboards. This leads to confusion and erodes trust. A structured governance approach ensures that reports remain accurate, purposeful, and easy to find.
Governance Tools in Power BI (Within Fabric)
Two practical tools can bring order and visibility to your reporting layer.
An Audit Dashboard helps administrators and developers understand how reports and datasets are being used. It tracks usage across workspaces, shows peak traffic times, and highlights reports with little or no activity. These insights make it easier to retire outdated content and plan capacity based on demand. Regular reviews of this type of dashboard help maintain a healthy reporting environment.
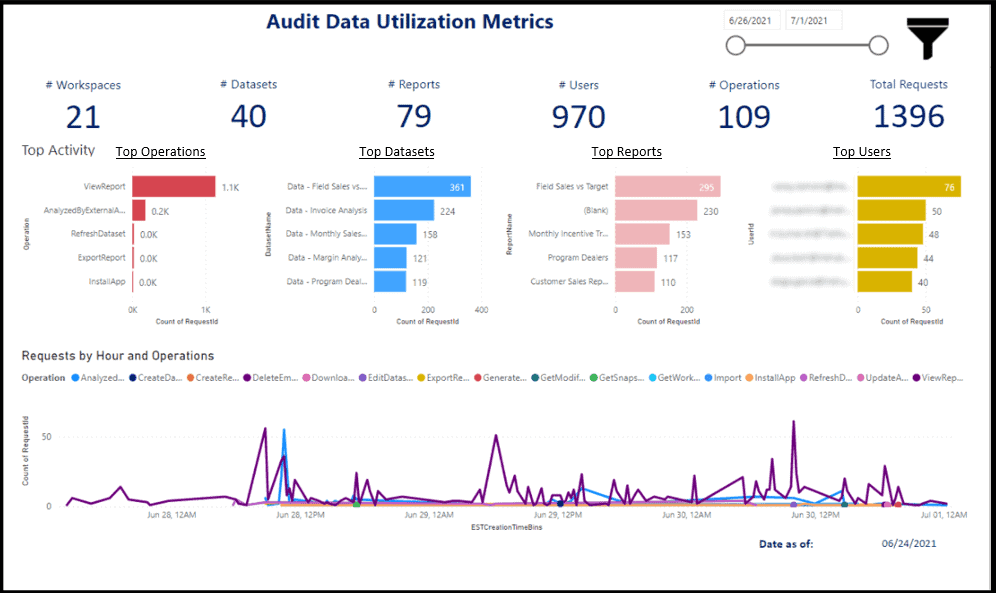
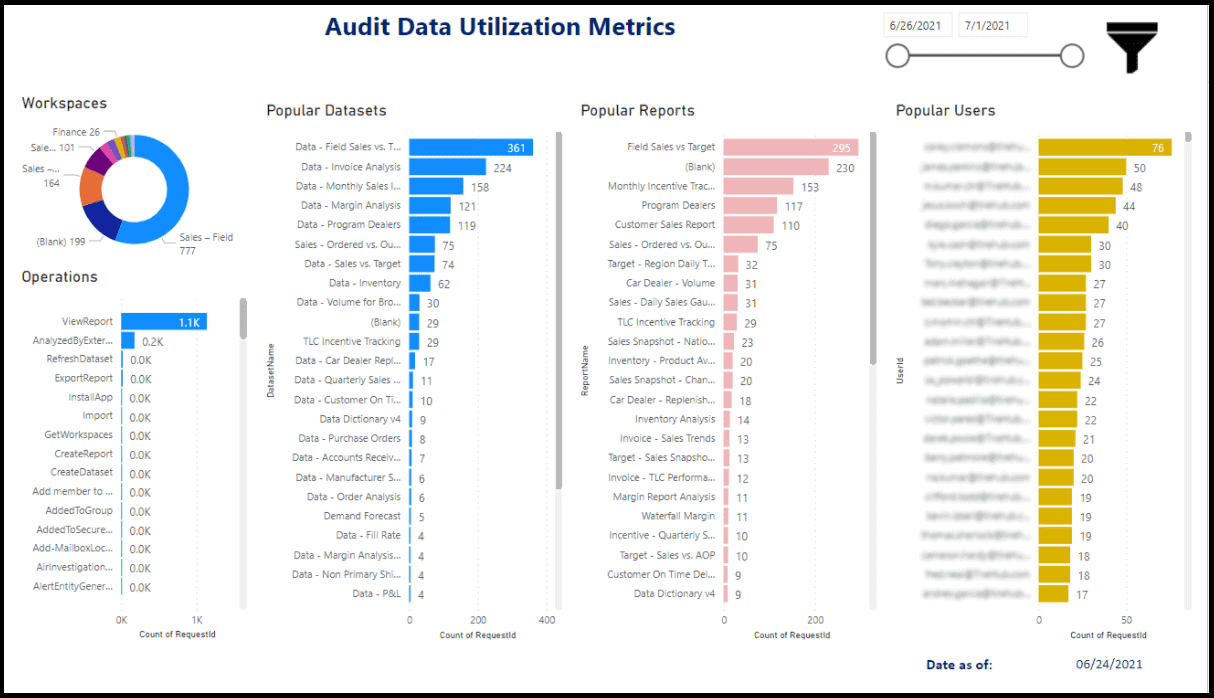
Power BI Audit Dashboards
The Data Dictionary Dashboard provides context behind every dataset and report. It draws metadata from APIs and Azure Data Factory to:
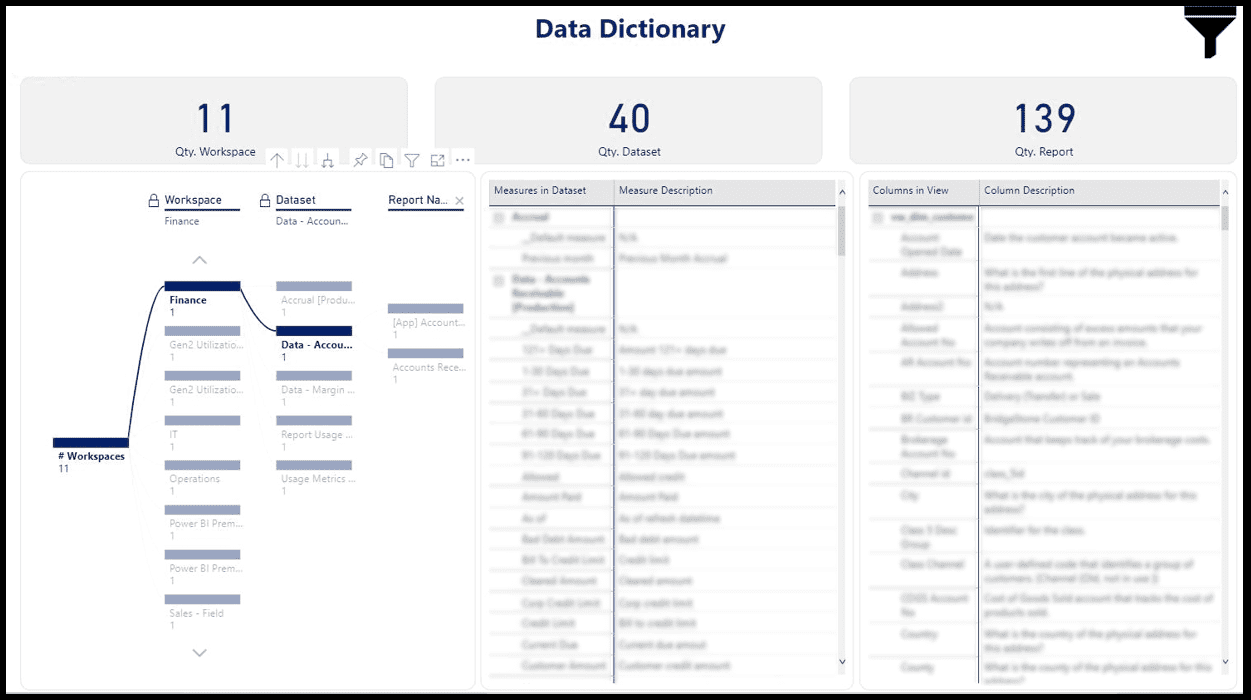
Data Dictionary
Report Governance Best Practices
Governance is also about education. When users understand how metrics are defined and where data originates, they are more likely to trust and adopt the reports available to them. Short reference guides or embedded explanations can provide quick context without requiring formal training.
Bringing It All Together
Report-level governance (Power BI governance) ensures that Fabric’s front-end experience stays aligned with your back-end governance strategy. With consistent semantic models, strong auditing, and clear documentation, every Power BI report becomes a trusted window into your data.
Keep Reading: Power BI Best Practices
Looking for more on data & analytics?
Explore more insights and expertise at smartbridge.com/data
There’s more to explore at Smartbridge.com!
Sign up to be notified when we publish articles, news, videos and more!
Other ways to
follow us:
