Power BI Governance
Ensure a Successful Power BI Deployment
You have Power BI, now what? With any new technology implementation, there are going to be some challenges to overcome such as how are you going to govern and monitor it. Luckily, you just deployed a new tool that can help you with that.
Article originally published February 2022
Implementing modern Business Intelligence (BI) tools continues to be a hot trend across all industries. Companies are quickly realizing they need improved reporting and analytics that are automated, provide improved visuals and drive quicker business insights. Microsoft Power BI is the market leader as it provides flexibility, horsepower, and advanced functionality all at an affordable price point.
However, with a new Power BI deployment comes challenges. A few of these can be:
Below are a few Power BI dashboards that can help businesses/users manage the above challenges.
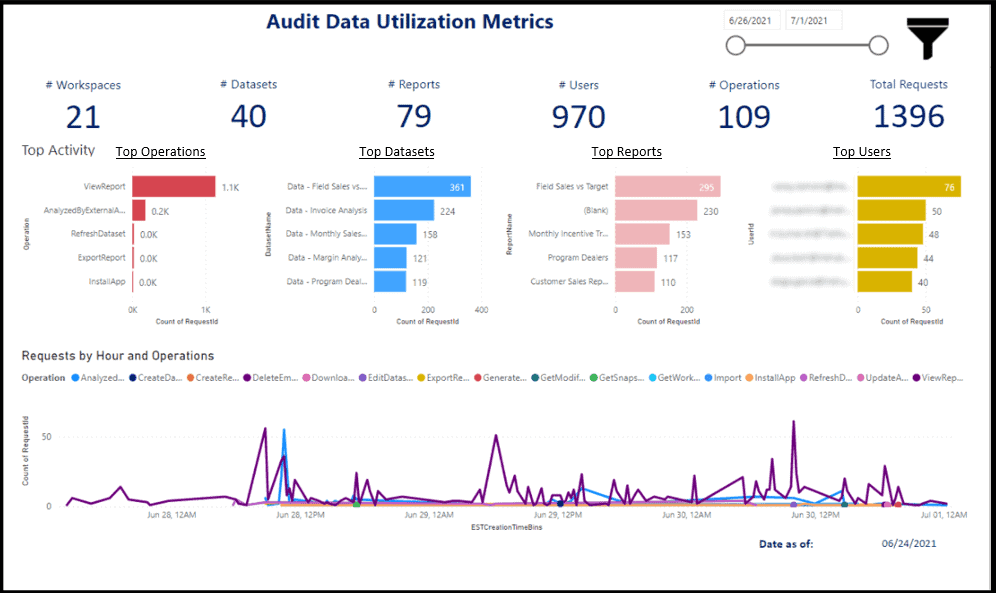
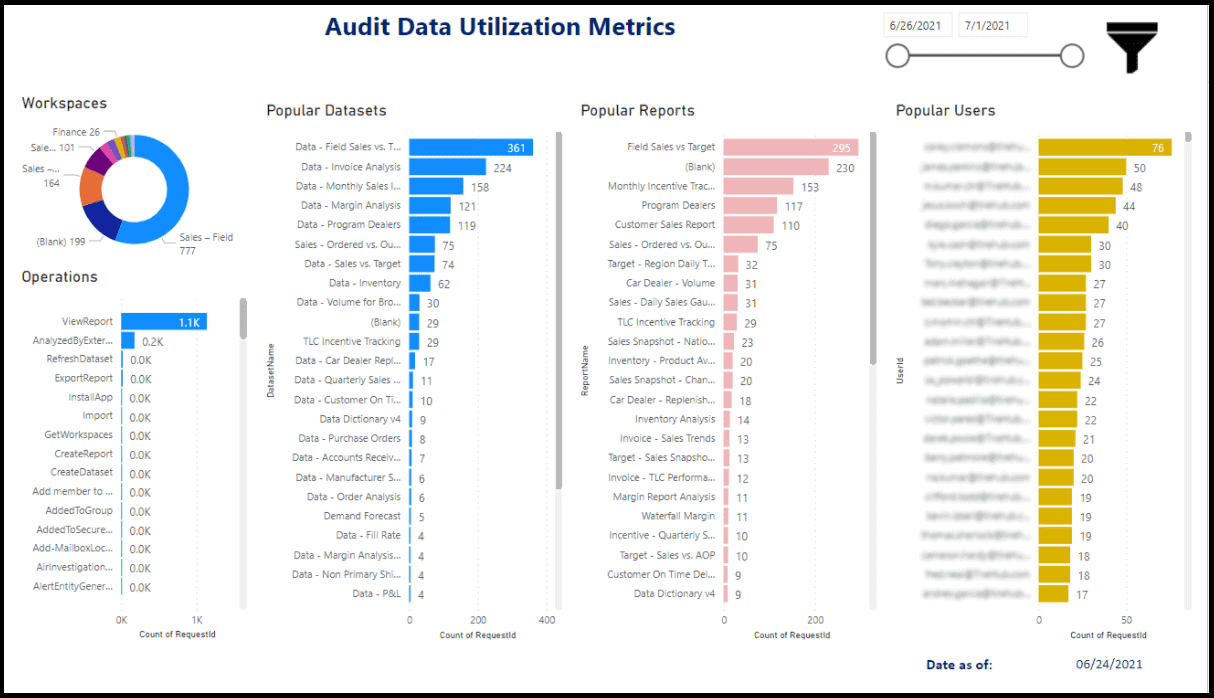
Power BI Audit Dashboards
The above Power BI Audit dashboards provide admins, developers, and managers the ability to:
The dashboard, which is connected to data in a document management system, leverages data power flows and enables organizations to improve resource allocation and prioritization.
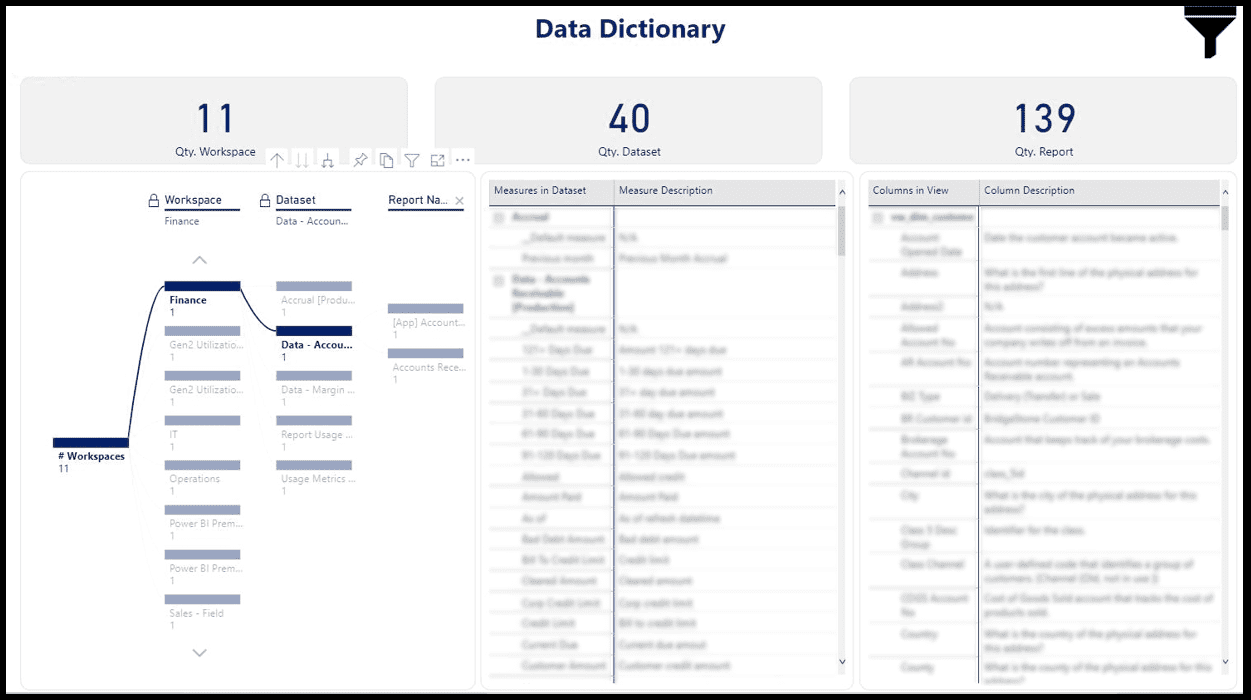
Data Dictionary
This Data Dictionary report is really a report of reports. It leverages metadata from multiple reports/sources through automated feeds from both APIs and Azure Data Factory (ADF). This new governance dashboard enables businesses to:
Governance and monitoring are a vital part of an effective BI deployment. Building some of these directly with Power BI enables users to get access to the training material, data catalogs, and quickly understand where to go to get the insights they need. Power BI has the ease of use, the tools, and can be leveraged to help keep your deployment running smooth.
Keep Reading: Power BI Best Practices
Looking for more on data & analytics?
Explore more insights and expertise at smartbridge.com/data
There’s more to explore at Smartbridge.com!
Sign up to be notified when we publish articles, news, videos and more!
Other ways to
follow us:


