

Enterprise Restaurant Inventory Software: Tools and Setup
A two-point food cost leak can outlast a spreadsheet for years. Here is how restaurant inventory management software closes it, and how to pick the right one.
Restaurant inventory management software tracks stock counts, purchasing, recipe costs, and actual vs. theoretical (AvT) food cost by pulling sales from the POS and prices from vendor invoices. Crunchtime and Restaurant365 already run inventory across hundreds to thousands of locations, and MarketMan, MarginEdge, and BlueCart belong on shortlists for narrower purchasing needs.
Food and non-alcoholic beverage costs ran at a median of 32.4% of sales for limited-service and 32.0% for full-service restaurants in 2024, according to NRA’s analysis of 2024 restaurant food cost ratios. The best tool is the one that shrinks your AvT variance fastest inside your existing POS and accounting stack.
That 32% median isn’t a target, and the NRA says so. But plenty of operators see anything in the low 30s and stop digging, which is exactly how a two-point leak survives for years. In a year of thin real growth, that leak is your profit.
What Is Restaurant Inventory Management Software?
Restaurant inventory management software is a back-office system that records counts, orders, and recipe costs, then compares the food you used with what your sales say you should have used.
That comparison is actual vs. theoretical food cost. Theoretical comes from POS sales multiplied by recipe specs. Actual comes from beginning inventory, plus purchases, minus ending inventory.
The gap is your variance. Waste, theft, spoilage, and over-portioning all hide there.
Most platforms also connect to suppliers and accounting, so purchases flow into cost of goods sold (COGS) without manual data entry. For IT leaders, that makes inventory management an integration project first and a software purchase second.
The stakes are higher this year. US restaurant and foodservice sales are projected to reach $1.55 trillion in 2026, but real growth is just 1.3%, according to the NRA’s 2026 State of the Industry projection. Volume won’t rescue margins. Cost control has to.
Why Spreadsheet Food Cost Numbers Are Already Out of Date
Spreadsheet and clipboard inventory counts produce a food cost percentage that is stale by the time anyone reads it, because vendor prices and sales change daily while the sheet updates weekly or monthly.
Price swings make that lag expensive. USDA’s September 2026 Food Price Outlook forecasts beef and veal prices up 9.4% for 2026. A burger costed in January is wrong by summer, and the spreadsheet won’t flag it.
Menus aren’t keeping pace. Food-away-from-home prices rose 3.4% year over year through August 2026, per USDA data reported by RFD-TV. When protein climbs faster than menu prices, the difference comes straight out of the P&L.
Clipboard counts add their own errors. A manager counts the walk-in after close, keys numbers into a spreadsheet the next afternoon, and transposes a case count. Multiply that across every store and the regional roll-up is fiction.
No wonder more than 90% of operators cite food, labor, insurance, and inflation as significant challenges heading into 2026, according to Nation’s Restaurant News coverage of 2026 cost pressures. Mobile inventory counts tied to real-time prices are the first fix.
Six Features That Move Food Cost: AvT, Recipe Costing, POS
The six features in restaurant inventory management software that most directly lower food cost are AvT variance reporting, live recipe costing, POS integration, invoice scanning, par-level ordering, and centralized dashboards.
Push every vendor to demo these with your own data:
Be realistic about what these tools fix. Overproduction makes up about 11.9% of restaurant and foodservice surplus food, while plate waste accounts for roughly 69.6%, according to ReFED’s restaurant and foodservice surplus data.
Inventory and forecasting software attacks the first number. Plate waste needs portion and menu changes. Forecasting pairs naturally with pars, and Smartbridge has covered real-time demand forecasting for restaurant operations in more depth.
How We Ranked Tools for Multi-Location Operators
We ranked restaurant inventory platforms on five criteria: multi-location scale, POS and accounting integration, AvT reporting depth, purchasing automation, and rollout support.
Scale came first. A tool that works for one bistro can buckle under hundreds of stores with regional menus and franchise reporting.
Integration came second, and it’s where most projects stall. Only 1 in 10 operators say their restaurants are at the technology forefront, while nearly 3 in 10 say they’re lagging, according to the NRA’s 2026 technology findings. Most groups are plugging a new tool into an older stack, so open APIs and clean data export matter more than polished dashboards.
The Savings Math: Your Food Cost Recovery Potential
Food cost recovery potential equals annual sales multiplied by the gap between your current food cost percentage and a realistic target, minus the full cost of the software.
Recovery = annual sales x (current food cost % – target food cost %) – total annual software cost
NRA data gives a grounded target. In 2024, full-service operators with $2 million or more in sales posted a median food cost of 31.0% versus 33.7% for those under $2 million, and median pre-tax income of 4.3% versus 1.1%, per NRA data on higher-volume restaurants.
Volume explains part of that gap, so it’s no software promise. Still, look at the pre-tax line. A 2.7-point food cost difference is bigger than the smaller group’s entire profit margin.
Run it on $1 million in annual sales and closing that 2.7-point gap is worth $27,000 a year before software costs. Repeat the math per location, then subtract subscription, implementation, and training.
Waste programs offer a sanity check. A Champions 12.3 study of 114 restaurant sites in 12 countries found an average 7:1 benefit-cost ratio for kitchen food waste reduction over three years. That covers waste programs broadly, so treat it as a ceiling check. And treat vendor savings ranges as marketing, since they rarely come with independent sourcing.
Restaurant365, Crunchtime, and Three Alternatives Compared
Crunchtime and Restaurant365 are the strongest documented fits for enterprise restaurant groups, while MarketMan, MarginEdge, and BlueCart are worth evaluating for narrower inventory or purchasing needs.
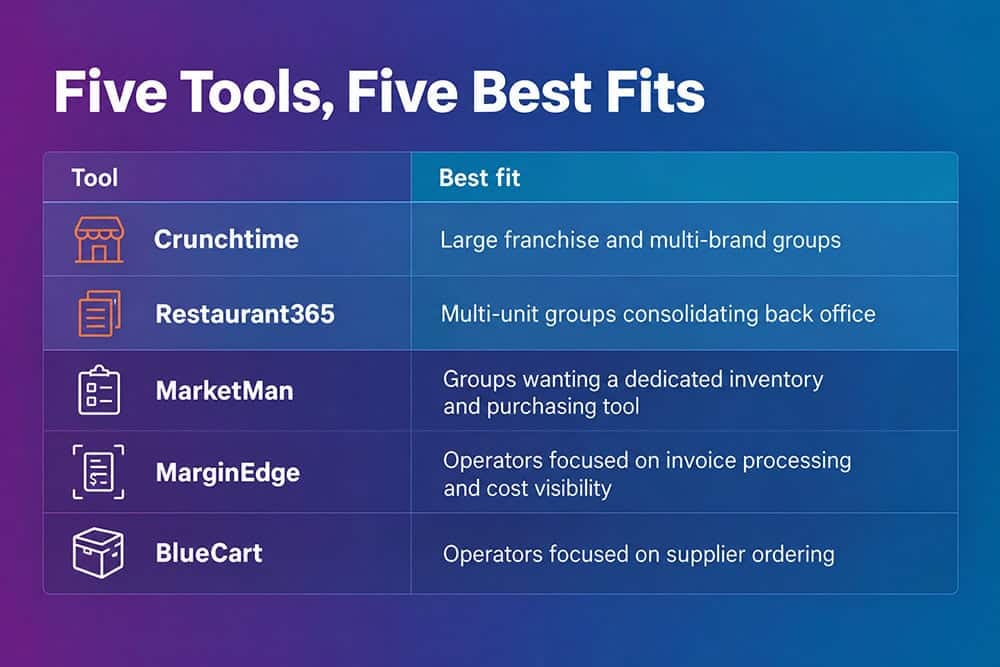
Crunchtime and Restaurant365 are the strongest documented enterprise fits; the other three suit narrower inventory or purchasing needs.
Crunchtime runs in more than 150,000 locations across 100+ countries, with customers including Chipotle, Domino’s, and Five Guys, per Crunchtime’s April 2026 announcement. That footprint is proof the platform holds up at franchise scale. In September 2026, Crunchtime also moved inventory and task management onto the kitchen display screen, combining kitchen, inventory, labor, and POS data in one analytics layer, as described in Crunchtime’s connected kitchen launch.
Restaurant365 is a back-office platform built around inventory, scheduling, labor, and reporting. In June 2026, Hungry Howie’s selected Restaurant365 for those functions across nearly 500 locations. That’s a group consolidating its back office onto one system.
The table below maps each tool to its best-fit operator and the question to press in a demo:
| Tool | Best-fit operator | Verify in the demo |
|---|---|---|
| Crunchtime | Large franchise and multi-brand groups | KDS and POS integration with your hardware |
| Restaurant365 | Multi-unit groups consolidating back office | Fit with current accounting and GL workflows |
| MarketMan | Groups wanting a dedicated inventory and purchasing tool | Depth of multi-location reporting |
| MarginEdge | Operators focused on invoice processing and cost visibility | AvT depth and POS connector list |
| BlueCart | Operators focused on supplier ordering | Recipe costing and count features |
Standalone Inventory Tool vs. All-in-One Platform
A standalone inventory tool handles counts, purchasing, and recipe costing in depth, while an all-in-one POS or accounting platform connects data from sale to P&L in one system.
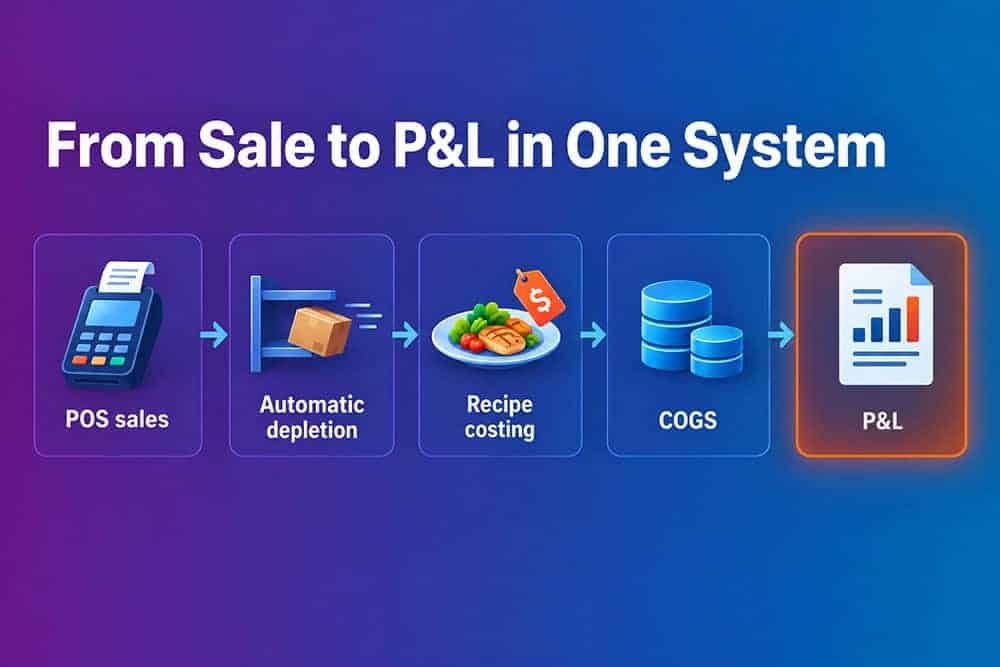
When these steps live in separate systems, finance reconciles them in spreadsheets and the variance report arrives too late to act on.
The three approaches compare like this:
| Approach | Strength | Trade-off |
|---|---|---|
| Standalone inventory tool | Deep counting and purchasing features | Depends on integration quality |
| POS-integrated suite | Real-time depletion from sales | Tied to one POS vendor |
| Accounting-connected platform | One COGS number from invoice to P&L | Heavier rollout and training |
For enterprise groups, we lean toward connected data. When purchasing, inventory, recipe costing, and accounting live in four systems, finance reconciles them in spreadsheets every period. By then the variance report is too old to act on.
Standalone tools still make sense when your POS and accounting are staying put. Test the POS sales feed first. Without reliable automatic depletion, theoretical food cost is a guess.
Free Restaurant Inventory Software: What You Give Up
Free restaurant inventory software and spreadsheet templates cost nothing to license but charge you in manager hours, missing POS integration, and food cost data that arrives too late to use.
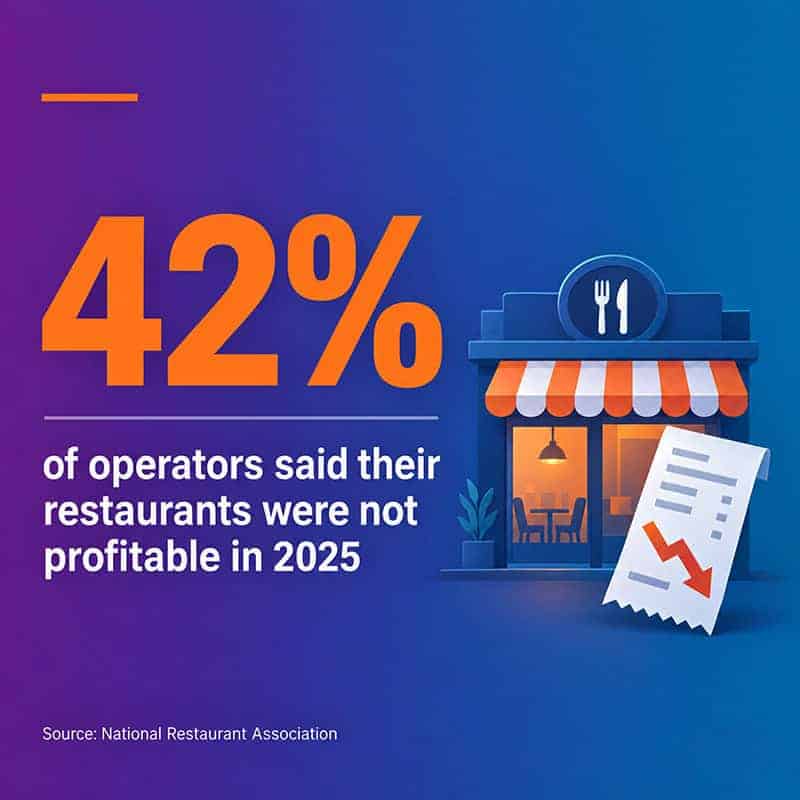
With margins this thin, the manager hours spent keying counts into free spreadsheets become a real cost for multi-unit groups.
Before adopting a free tool, check whether it caps locations, users, or integrations. Then check whether it connects to your POS at all.
The hidden cost is labor. Every hour spent keying counts and invoices into a spreadsheet is an hour off the floor, and manual entry invites the errors software catches.
Margins make that trade harder to justify. 42% of operators said their restaurants were not profitable in 2025, according to the NRA’s 2026 industry outlook. Free tools suit a single location building the counting habit. For a multi-unit group, they’re a false economy.
A 90-Day Rollout Plan From Clean Data to Variance Reviews
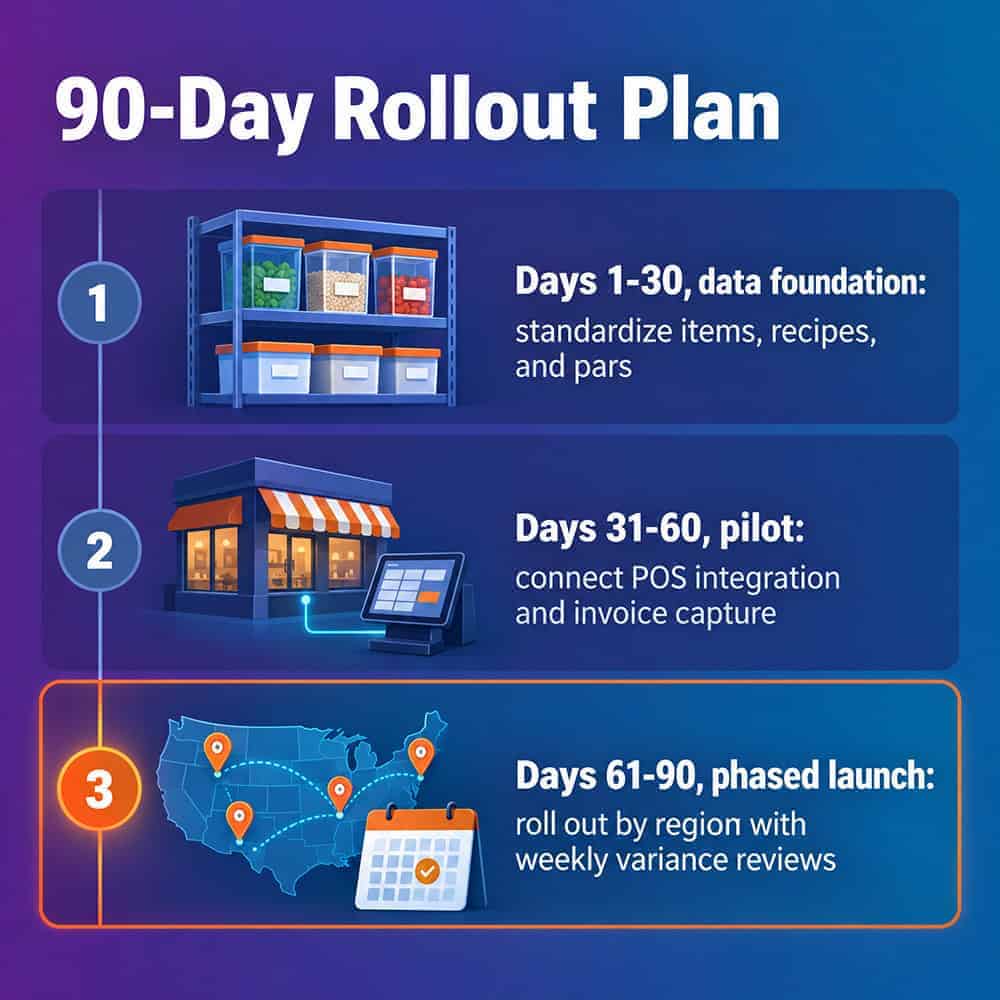
An enterprise inventory software rollout works best in three phases over roughly 90 days: clean data, pilot stores, then a phased multi-location launch with weekly variance reviews.
Ninety days buys clean data and measurable progress; in the Champions 12.3 study, 76% of sites recouped waste investments within one year.
Pars matter more as operators cut stock. 39% of operators with 16 or fewer locations plan to run leaner inventory in response to rising costs, up 12 points from 2025, per Toast’s 2026 Voice of the Restaurant Industry survey. Lean inventory without pars just means more stockouts.
We recommend this sequence:
- 1
Days 1-30, data foundation: standardize item names, units, and recipes. Set par levels per store, lock a consistent count schedule, and train teams on FIFO rotation.
- 2
Days 31-60, pilot: connect POS integration and invoice capture in two or three representative stores. Run weekly mobile inventory counts and review the first AvT reports.
- 3
Days 61-90, phased launch: roll out by region, publish a centralized dashboard, and hold weekly variance reviews with store managers.
Keep payback expectations grounded. In the Champions 12.3 business case, 76% of restaurant sites recouped their food waste investment within one year and 89% within two, per Sustainable Brands’ summary of the payback data. Ninety days buys clean data and measurable progress on the trend line. Full ROI can take longer.
Automation can also take over the audit step. Smartbridge’s case study on how a restaurant group used RPA for inventory auditing shows what that looks like in practice.
Red Flags to Catch Before You Sign
The biggest red flags in a restaurant inventory software evaluation are weak POS integration, shallow AvT reporting, locked-in data, and quotes that hide implementation costs.
Walk away, or push hard, if you hear any of these:
Total cost of ownership is where budgets slip. Smartbridge’s breakdown of hidden costs in ERP software implementation applies to inventory platforms too.
Quick Answers on Restaurant Inventory Software
What is the best inventory management system for restaurants?
The best restaurant inventory management system depends on location count and existing stack. Large franchise and multi-brand groups should start with Crunchtime and Restaurant365. Smaller groups can shortlist MarketMan, MarginEdge, or BlueCart and test POS integration first.
What are the top 5 inventory management software tools for restaurants?
The five restaurant inventory tools most worth comparing are Restaurant365, Crunchtime, MarketMan, MarginEdge, and BlueCart. Rank them against your POS, accounting system, and location count.
Is there a free Excel template for restaurant inventory?
Free Excel and Google Sheets inventory templates exist and work for a single location. They can’t pull POS sales or invoice prices automatically, so recipe costing and variance tracking stay manual.
Does AI help lower food cost?
AI shows early results in food cost control, though the best data comes from a vendor. In Restaurant365’s mid-2026 industry report, 61% of operators actively using AI reported lower food costs, and 12.5% named inventory forecasting as a use case. Treat it as directional. Smartbridge’s piece on an AI agent for restaurant inventory forecasting and P&L goes further.
Your Next Steps This Week
Enterprise restaurant operators can start cutting food cost this week by measuring current variance, mapping integrations, and shortlisting two platforms.
- 1Pull last quarter’s food cost percentage by store and rank the outliers.
- 2List your POS, accounting, and supplier systems, and note which offer open APIs.
- 3Pick one high-variance store as your pilot.
- 4Request demos and full per-location quotes from two vendors.
- 5Set one 90-day metric: weekly AvT variance by store.
Software doesn’t fix a food cost problem nobody measures. Start with one honest count and a connected data foundation, and you’ll make decisions with less guesswork. Talk to a Smartbridge expert about your data foundation, or start with our guide to restaurant analytics dashboards and profitability KPIs.