

Restaurant Analytics Dashboards:
KPIs That Drive Profitability
Restaurant analytics dashboards track the metrics separating profitable operations from those struggling to survive. Operating costs have surged approximately thirty percent since 2019, driven by food and labor increases that squeeze thin margins.
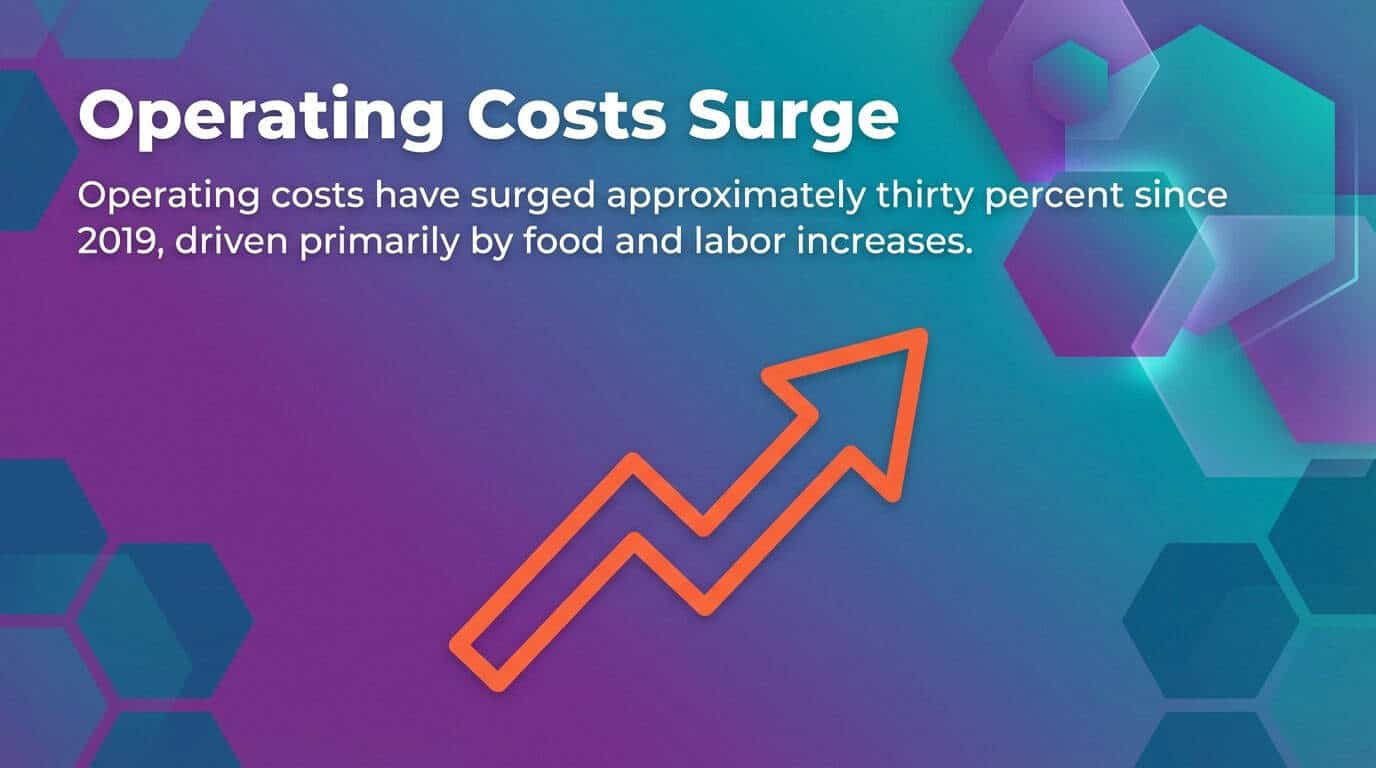
Operating costs are up roughly 30% since 2019, largely from food and labor inflation—tightening already thin margins.
Forty-two percent of restaurant operators were not profitable in 2025, according to the National Restaurant Association. The operators who thrived built their strategies on real-time data analytics and reporting systems that turned transaction data into operational intelligence.
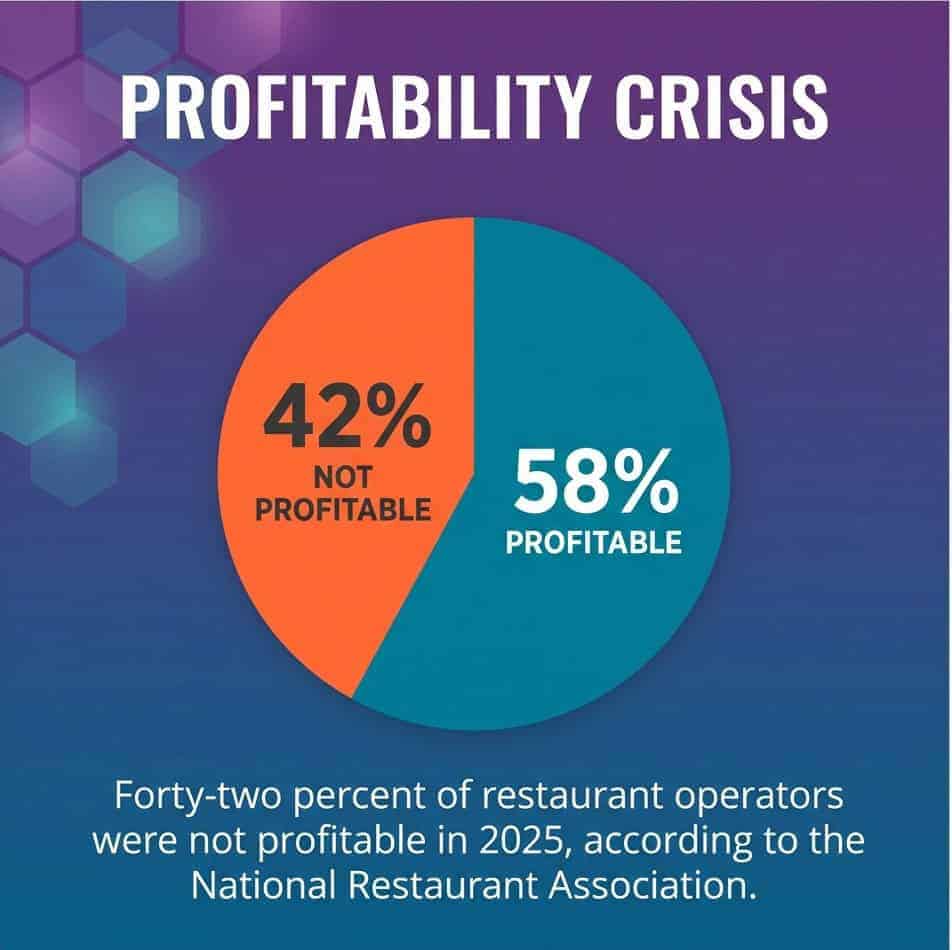
42% of operators were not profitable in 2025—underscoring the need for real-time analytics and disciplined execution.
Your POS system generates thousands of data points per day. Sales data flows through every transaction. Customer behavior patterns emerge from ordering trends. Inventory management systems track stock levels and food costs. Most restaurant operators watch profits disappear because they lack the analytics infrastructure to spot problems before they compound.
These are the key performance indicators that separate profitable restaurant operations from those operating on instinct. You’ll learn which metrics matter most, how to structure reporting dashboards for action, and where to focus data-driven decisions for measurable business value.
Understanding Restaurant Analytics Fundamentals
Restaurant analytics transforms raw data from your POS system into business intelligence that drives operational decisions. Every transaction generates data points about sales performance, customer preferences, menu items, and labor costs. The challenge is organizing this information into meaningful patterns.
Analytics dashboards aggregate data from multiple sources into centralized platforms. Your POS system provides sales data and transaction histories. Inventory management systems track food costs and stock levels. Scheduling software monitors labor costs and employee performance. Real-time data integration creates a unified view of restaurant operations.
Modern restaurant analytics implementations demonstrate how data integration drives profitability improvements across multi-unit operations.
Core Data Sources for Restaurant Intelligence
POS systems are the primary data source for restaurant analytics. Transaction-level detail captures menu items sold, prices, discounts, payment methods, and timestamps. This granular data reveals patterns in customer behavior and identifies peak hours for traffic planning.
Inventory management systems provide the second critical data stream. Real-time tracking of stock levels, supplier costs, and waste patterns enables precise food cost calculations. Restaurants lose between four and ten percent of revenue to preventable food waste. Analytics platforms that connect inventory data with sales trends reduce this waste.

Preventable food waste drains 4–10% of revenue, integrated inventory and sales analytics can significantly reduce it.
Labor management platforms contribute scheduling data, clock-in times, and productivity metrics. Labor represents one of the two largest cost categories in restaurant operations, consuming between twenty-five and thirty-five percent of total revenue. Tracking these costs against sales performance reveals staffing efficiency opportunities.
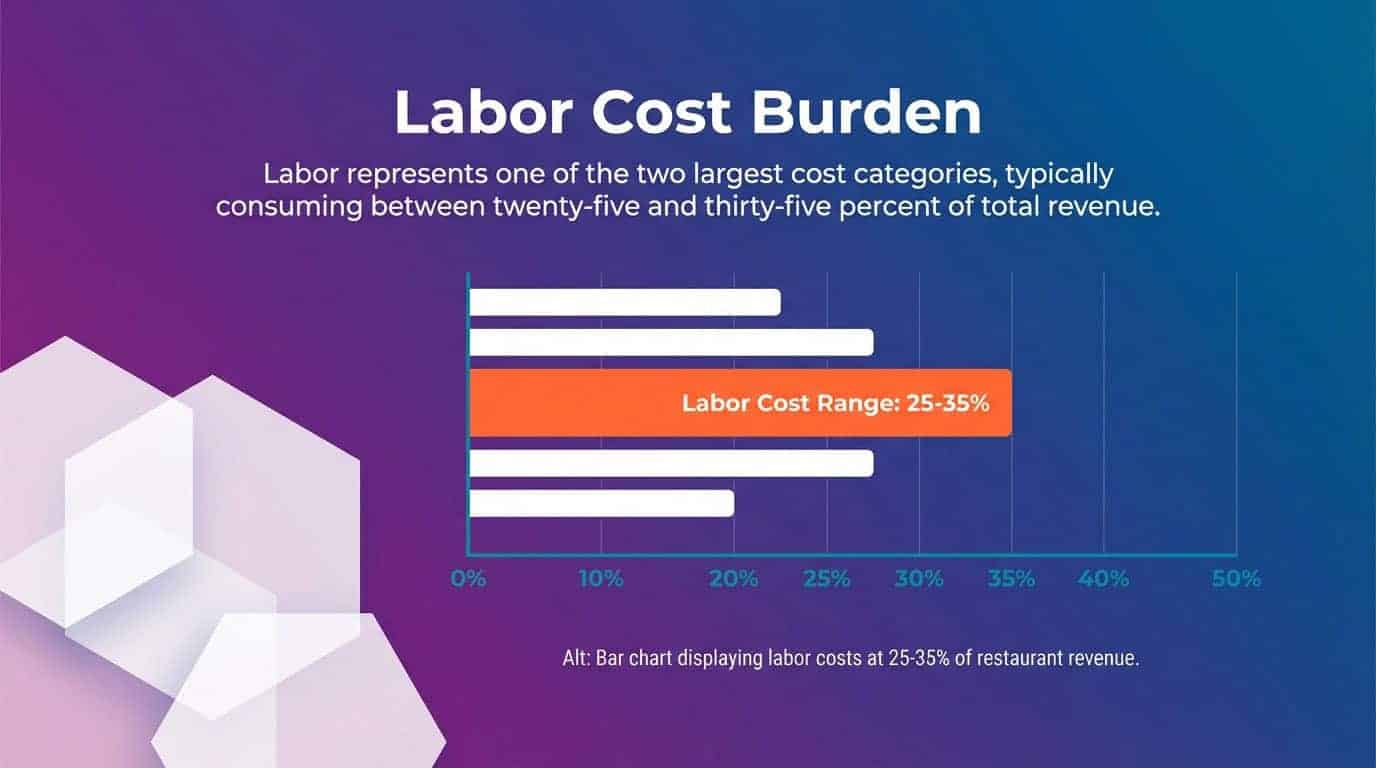
Labor typically consumes 25–35% of revenue—making real-time scheduling and productivity analytics essential.
From Data Collection to Actionable Insights
Data collection alone provides no value. Restaurant analytics platforms must transform raw numbers into insights that drive specific operational changes. This requires three components: data integration, analysis frameworks, and reporting dashboards.
Integration connects disparate systems into unified data platforms. Your POS data means little until you pair it with inventory costs and labor scheduling. Analytics platforms aggregate these streams, creating relationships between sales patterns, staffing levels, and profitability margins.
Analysis frameworks apply business logic to integrated data. Menu engineering compares item popularity against profit margins. Labor analytics match staffing patterns to customer traffic. Inventory optimization balances stock levels against demand forecasting.
Reporting dashboards present analyzed data in formats that support decisions. Real-time monitoring identifies problems as they develop. Trend analysis reveals patterns over weeks and months. Comparative reporting benchmarks performance across locations or time periods.
Analytics maturity evolves through stages, from basic reporting to predictive intelligence that anticipates operational needs.
Critical KPIs Every Restaurant Dashboard Needs
Key performance indicators measure restaurant success across financial, operational, and customer dimensions. Tracking the right metrics separates strategic management from putting out fires. These KPIs provide the foundation for data-driven decisions that improve profitability.
Financial Performance Metrics
The average pre-tax profit margins for restaurants range from three to five percent across most segments. This narrow margin demands precise tracking of revenue and cost metrics.
Daily sales tracking monitors revenue patterns and identifies trends. Compare sales against historical data, day-of-week averages, and seasonal patterns. Real-time sales reporting enables quick response to underperformance.
Average check size measures customer spending per transaction. Track this metric by daypart, server, and menu category. Declining average checks signal pricing problems or menu mix issues that need attention.
Cost of goods sold represents the total food and beverage expenses as a percentage of sales. Target COGS between 28 and 35 percent for most restaurant concepts. Weekly COGS tracking catches pricing errors and portion control problems before they damage profitability.
| Financial KPI | Target Range | Tracking Frequency |
|---|---|---|
| Net Profit Margin | 3-5% | Monthly |
| Prime Cost (COGS + Labor) | 60-65% | Weekly |
| Average Check Size | Concept-Dependent | Daily |
Net profit margins fall between three and five percent for full-service segments. Operating above these benchmarks requires disciplined cost control across labor and inventory categories.
Operational Efficiency Indicators
Table turnover rate measures how many times each table serves customers during a shift. Higher turnover increases revenue per available seat. Track turnover by daypart and compare against capacity to identify bottlenecks in service flow.
Revenue per available seat hour (RevPASH) targets range from ten to fifteen dollars per seat per hour for healthy operations. This metric combines pricing strategy with operational efficiency, revealing both menu optimization and service speed opportunities.
Labor cost percentage tracks total labor expenses against sales revenue. Calculate this daily and weekly to catch scheduling inefficiencies. Compare labor costs across locations to identify best practices in multi-unit operations.
Food waste tracking quantifies money lost to spoilage, over-preparation, and plate waste. Implement waste logs that categorize losses by source. Analytics platforms that connect waste data with prep schedules reduce losses through better demand forecasting.
Customer Behavior Analytics
Customer frequency measures how often guests return. Track visit patterns through loyalty programs or payment data. Increasing visit frequency costs less than acquiring new customers.
Customer acquisition in the restaurant industry costs between five and twenty-five times more than retaining existing customers. This makes retention metrics critical for profitability.
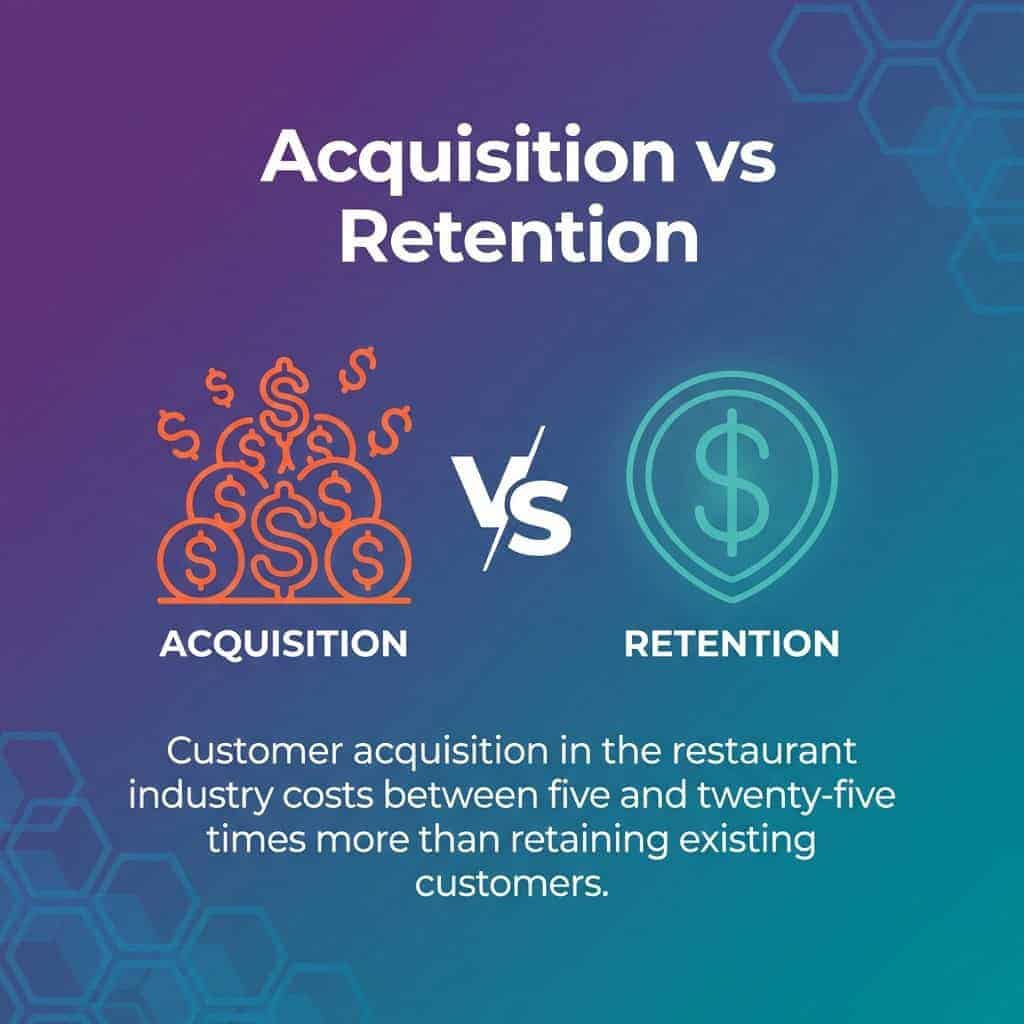
Acquiring guests costs 5–25x more than retaining them—another reason to double down on loyalty and personalization.
Menu item performance reveals which dishes drive sales and profits. Track each item’s sales volume, contribution margin, and popularity ranking. This data supports menu optimization decisions that improve profitability.
Peak hours analysis identifies when customer demand concentrates. Overlay traffic patterns with staffing schedules to ensure appropriate labor allocation. Under-staffing during peak hours damages customer satisfaction while over-staffing in slow periods erodes margins.
Building Sales Analytics That Inform Strategy
Sales data analysis transforms transaction records into strategic insights about revenue patterns, menu performance, and growth opportunities. Your POS system captures every sale, but raw transaction data needs structured analysis to reveal patterns you can act on.
Revenue Trend Analysis
Daily sales tracking provides the baseline for performance monitoring. Compare each day’s revenue against the same day in previous weeks, months, and years. This time-series analysis identifies growth trends and seasonal patterns that inform forecasting.
Sales mix analysis breaks revenue into component categories. Track performance by menu category, daypart, service channel, and location. Understanding which revenue streams drive growth focuses investment in high-performing areas.
Year-over-year comparisons account for seasonal variation in restaurant traffic. Compare each week to the same week in the prior year. Track the growth rate to measure whether operational changes improve performance.
Real-time sales reporting enables quick response to performance issues. Monitor sales hourly during service periods. When revenue falls below expectations, investigate causes now rather than discovering problems days later through reports.
Menu Performance Analytics
Menu engineering combines item popularity with profitability to categorize every dish. Plot each menu item on a matrix comparing sales volume against contribution margin. This analysis reveals stars (popular and profitable), plowhorses (popular but low margin), puzzles (low volume but profitable), and dogs (unpopular and unprofitable).
Contribution margin measures the profit each menu item generates after direct food costs. Calculate this for every dish and beverage. Price adjustments, portion modifications, and menu positioning changes should prioritize high-margin items.
Item velocity tracking measures how fast menu items sell during service periods. Fast sellers need efficient prep systems and adequate inventory. Slow sellers tie up capital in unused ingredients and create waste risk.
Power BI implementations for national restaurant companies demonstrate how unified analytics platforms connect menu performance across hundreds of locations.
Pricing Strategy Analytics
Price elasticity analysis reveals how sales volume responds to price changes. Test price adjustments on select items and measure the impact on sales volume and total contribution. This data informs menu pricing decisions that optimize revenue.
Competitive pricing analysis compares your menu prices against local competitors. Track relative pricing positions for comparable items. Big price gaps need justification through quality differentiation or you risk losing price-sensitive customers.
Promotional effectiveness measures how limited-time offers and discounts impact sales and profitability. Calculate the extra revenue from promotions against the margin sacrifice. Successful promotions increase total contribution despite lower per-item margins.
Customer Behavior Insights That Build Loyalty
Customer behavior analytics reveal patterns in ordering preferences, visit frequency, and spending habits. These insights drive personalization strategies that increase visit frequency and customer lifetime value.
Visit Pattern Analysis
Customer segmentation groups guests by visit frequency and spending patterns. Identify your most valuable customers through transaction history analysis. These segments receive targeted marketing that increases visit frequency and spending.
Visit interval tracking measures time between customer visits. Declining visit frequency signals satisfaction problems or competitive pressure. Targeted re-engagement campaigns win back customers before they defect.
Daypart preferences reveal when different customer segments prefer to visit. Track individual customer patterns to time promotional offers for maximum relevance. Send lunch specials to daytime visitors and dinner promotions to evening guests.
Order Pattern Intelligence
Basket analysis identifies which menu items customers order together. These patterns inform combo meal creation, upsell suggestions, and menu layout optimization. Servers equipped with pairing insights increase average check size through relevant recommendations.
Modification tracking records how customers customize menu items. Frequent modifications signal opportunities for new menu variations. Popular additions become premium options that increase check averages.
Reorder rates measure how often customers purchase the same items on return visits. High reorder rates indicate signature dishes that drive loyalty. Low reorder rates suggest variety-seeking behavior that needs menu rotation.
Customer Satisfaction Metrics
Review sentiment analysis applies natural language processing to online reviews and feedback. Track sentiment trends over time to identify service improvements or quality declines. Respond to negative sentiment patterns before they damage reputation.
Net Promoter Score surveys measure customer willingness to recommend your restaurant. Track NPS by location, daypart, and customer segment. This metric predicts organic growth through word-of-mouth referrals.
Customer complaint tracking quantifies service failures and quality issues. Categorize complaints by type and track resolution times. Analytics platforms that connect complaint data with operational metrics reveal root causes.
Inventory Management Through Data Analytics
Inventory management analytics balance stock levels against demand forecasting to minimize waste and prevent stockouts. Real-time tracking of inventory costs, usage patterns, and supplier performance drives profitability improvements across the supply chain.
Food Cost Control
Theoretical versus actual food cost comparison reveals waste, theft, and portion control problems. Calculate theoretical costs by multiplying sold items by recipe costs. Compare against actual inventory usage to identify variance.
Recipe costing breaks each menu item into component ingredients and their costs. Update these calculations when supplier prices change. Accurate recipe costs inform menu pricing decisions and profitability analysis.
Variance analysis investigates differences between theoretical and actual food costs. Track variance by ingredient category and kitchen station. Persistent variance in specific areas indicates training needs or process improvements.
Demand Forecasting
AI-powered demand forecasting systems are aiming to reduce food waste by 30-40%. These platforms analyze historical sales data, weather patterns, local events, and day-of-week trends to predict future demand.
Prep planning tools convert sales forecasts into ingredient requirements. Calculate how much to prep for each shift based on predicted demand. This precision reduces waste while ensuring adequate supply during service.
Seasonal adjustment models account for predictable demand fluctuations. Track sales patterns across years to identify seasonal trends. Adjust inventory ordering and prep quantities ahead of high-demand periods.
Supplier Performance Analytics
Price tracking monitors ingredient costs from each supplier over time. Identify price increases fast and negotiate or source alternatives. Comparative supplier analysis reveals opportunities to reduce costs through vendor switches.
Delivery reliability metrics measure on-time performance and order accuracy. Track stockouts caused by supplier failures. This data supports vendor negotiations and sourcing decisions.
Quality incident tracking documents product quality issues by supplier and ingredient. Frequent quality problems justify vendor changes despite competitive pricing. Ingredient quality affects customer satisfaction and food safety.
Labor Analytics for Operational Efficiency
Industry turnover averages seventy percent or higher, creating constant recruitment and training costs that damage profitability. Labor analytics optimize scheduling, track productivity, and reduce turnover through data-driven management.
Scheduling Optimization
Labor cost percentage tracks total labor expenses as a percentage of sales. Calculate this metric daily and weekly. Target labor costs between 25 and 35 percent depending on service model and concept.
Sales per labor hour measures employee productivity. Divide total sales by total labor hours worked during each shift. Compare this metric across shifts, locations, and time periods to identify efficiency opportunities.
Schedule forecasting aligns staffing levels with predicted customer demand. Use sales forecasts to determine required labor hours. Build schedules that maintain service quality during peak hours while minimizing excess labor during slow periods.
Employee Performance Tracking
Server performance metrics compare sales, average check, and customer satisfaction across team members. Identify top performers and share their techniques through training. Address consistent underperformance through coaching or role changes.
Kitchen productivity measures output per labor hour in production areas. Track meals prepared, tickets completed, and quality incidents. This data reveals training needs and process improvement opportunities.
Attendance and punctuality tracking identifies reliability issues before they disrupt operations. Monitor tardiness, absences, and shift coverage problems. Consistent issues signal engagement problems that increase turnover risk.
Turnover Analysis
Turnover rate calculation measures how often employees leave. Track overall turnover and segment by position, tenure, and location. High turnover in specific roles or locations indicates management or workplace issues that need attention.
Turnover cost analysis quantifies the financial impact of employee departures. Include recruitment costs, training time, and productivity losses during ramp-up periods. This analysis justifies retention investments.
Exit interview insights reveal why employees leave. Track reasons by category and identify patterns. Address systemic issues that drive turnover across the organization.

Real-Time Reporting for Quick Action
Real-time data analytics enable operational adjustments during service rather than discovering problems through historical reports. Mobile analytics apps provide managers with instant access to performance metrics anywhere in the restaurant.
Live Service Monitoring
Hourly sales tracking compares current performance against targets and historical benchmarks. Monitor revenue trends throughout service periods. Slow sales trigger promotional responses or labor adjustments now.
Table status monitoring tracks seating availability, wait times, and table turnover in real-time. This visibility enables hosts to manage seating flow and servers to prioritize table service.
Kitchen performance metrics track ticket times, order accuracy, and production bottlenecks during service. Real-time monitoring identifies problems as they develop rather than through customer complaints.
Mobile Analytics Access
Kitchen intelligence systems for multi-unit restaurants provide real-time operational data accessible from mobile devices, enabling managers to monitor performance across locations.
Dashboard apps present key metrics in mobile-optimized formats. Check sales, labor costs, and inventory levels from anywhere. Push notifications alert managers to performance issues that need attention.
On-demand reporting generates custom reports from mobile devices. Pull specific metrics or time periods without waiting for scheduled reports. This flexibility supports rapid decisions during operations.
Alert Configuration
Performance threshold alerts notify managers when metrics exceed acceptable ranges. Configure alerts for high labor costs, low sales pace, inventory shortages, or quality incidents. Quick notification enables rapid response.
Variance alerts identify unusual patterns in real-time data. Sudden spikes in waste, unexpected sales declines, or abnormal transaction patterns trigger investigation before problems compound.
Predictive alerts use historical patterns to forecast problems before they occur. Inventory systems warn of impending stockouts based on current usage rates. Labor platforms identify potential overtime before it happens.
Multi-Location Analytics and Standardization
Enterprise restaurant analytics aggregate data across multiple locations to identify best practices, benchmark performance, and standardize operations. Centralized reporting platforms reveal which locations outperform and why.
Comparative Performance Analysis
Location benchmarking ranks units by key performance indicators. Identify top performers in sales, profitability, customer satisfaction, and operational efficiency. Study what these locations do differently and replicate their practices.
Same-store sales growth measures organic performance improvement excluding new locations. Track this metric to assess whether operational initiatives improve existing unit performance. Declining same-store sales signal competitive pressure or execution problems.
Regional performance comparison groups locations by market characteristics. Urban versus suburban, tourist versus residential, and competitive versus monopolistic markets perform differently. Compare units within similar contexts for meaningful benchmarks.
Best Practice Identification
Analytics modernization for global restaurant groups enables identification of operational best practices across hundreds of locations through centralized data platforms.
Process standardization uses data to identify optimal operational procedures. When certain locations outperform in specific metrics, document their processes. Roll out these practices across the organization through training and operational standards.
Menu optimization across locations reveals which items perform well in different markets. Test new items in select locations before system-wide rollout. Remove poor performers identified through consistent underperformance across multiple units.
Centralized Reporting Infrastructure
Data integration platforms aggregate information from distributed POS systems, inventory management tools, and labor platforms. Centralized data enables enterprise-level analysis impossible with location-specific systems.
Role-based reporting provides different views for corporate leadership, regional management, and unit-level operators. Executives need high-level trends and comparisons. Store managers need operational detail for their specific locations.
Automated report distribution delivers scheduled analytics to stakeholders without manual effort. Daily sales summaries, weekly labor reports, and monthly financial analyses arrive on schedule. This automation ensures consistent management attention to critical metrics.
Implementing Restaurant Analytics Successfully
Restaurant analytics implementation needs planning rather than patchwork adoption of disconnected tools. The most successful organizations blend analytics platforms with operational discipline and staff training to ensure data drives decisions.
Building Your Analytics Foundation
Start with POS system integration as your data foundation. Modern point-of-sale platforms provide APIs that connect to analytics tools and reporting dashboards. Ensure your POS captures transaction-level detail including items sold, modifiers, discounts, and timestamps.
Add inventory management system integration next. Connect purchasing, receiving, and waste tracking to create accurate food cost analytics. Real-time inventory tracking enables the demand forecasting and waste reduction that improve profitability.
Implement labor management platforms that integrate with scheduling and time-tracking systems. This connection creates the data foundation for labor cost analytics and productivity measurement.
Selecting Analytics Platforms
Evaluate analytics platforms based on integration capabilities with your existing systems. The best analytics tools connect to your POS, inventory, and labor platforms without manual data entry.
Assess reporting flexibility and customization options. Different stakeholders need different views of operational data. Your analytics platform should support role-based dashboards and custom report creation.
Consider mobile access and real-time capabilities. Managers need operational visibility during service, not historical reports. Mobile analytics apps enable quick response to developing problems.
Training and Adoption
Train managers to interpret analytics dashboards and take appropriate actions. Data without action provides no value. Teach teams to recognize concerning trends and implement corrective measures.
Establish regular review cadences for key metrics. Daily sales reviews, weekly labor analysis, and monthly profitability assessments create accountability and ensure analytics inform decisions.
Share performance data with frontline staff to build engagement. When servers understand how their sales performance compares to peers, they increase check averages through better upselling. Kitchen staff who see waste metrics take more care with portions and prep planning.
Restaurant technology adoption studies reveal that successful implementations prioritize user training alongside system deployment.
The Path Forward for Restaurant Intelligence
Restaurant analytics separate profitable operations from those operating on instinct in competitive markets. The data infrastructure exists in your POS system, inventory management platforms, and labor tools. The opportunity is connecting these systems into unified analytics dashboards that reveal patterns invisible in isolated data streams.
Begin with the financial KPIs that affect profitability. Track daily sales, cost of goods sold, and labor cost percentage. These metrics provide feedback on operational health and highlight problems that need attention.
Expand into customer behavior analytics that drive loyalty and visit frequency. Understanding ordering patterns, visit intervals, and satisfaction trends enables targeted marketing that costs less than constant customer acquisition.
Build inventory management capabilities that reduce waste and optimize stock levels. The operational efficiency gains from better demand forecasting and supplier management flow to improved margins.
Restaurant operators who invest in analytics infrastructure today build the operational discipline that compounds over time. Small improvements in labor efficiency, food cost control, and customer retention create profitability advantages when sustained.
Your data contains the insights needed to outpace competitors. The question is whether you’ll build the analytics capabilities to uncover them.