Translate Stories into Insights Fast with Microsoft Power BI
Data is a summary of thousands of stories. Crafting the right story will reveal invaluable insights that will set you up for a better outcome. Microsoft Power BI is one way to achieve short-term goals or stopgap measures.
Data has been an integral part of human history, but modern technology empowers us to analyze it with unprecedented precision. Let’s walk through just how to take a situation and craft it in a way that will allow us to analyze all the data that is coming in.
This high-level introduction to getting started with Microsoft Power BI is based off a simple dashboard deployment with real-time analytics that provide timely insights.
It’s critical to invest your efforts wisely in BI projects that will effectively manage and monitor productivity, employee performance, organizational efficiency, and business productivity. Let’s walk through the steps to creating a dashboard in Power BI.
1. Build Your Case
2. Source Your Data
Now that you have your case, find a reliable source of data that includes those dimensions and metrics. With Power BI Desktop, you can connect to data from many different sources such as:
3. Clean, Transform, and Reshape Your Data
By using tools like PowerQuery and DAX, you can manipulate your source and get the expected outcome of data that you will then be able to use when it comes to modeling and visualizing.
4. Build Your Model
Data can come from multiple sources/tables. By building your model you will teach Power BI how to understand the relationship between them.
5. Build Your Measures and Visualizations
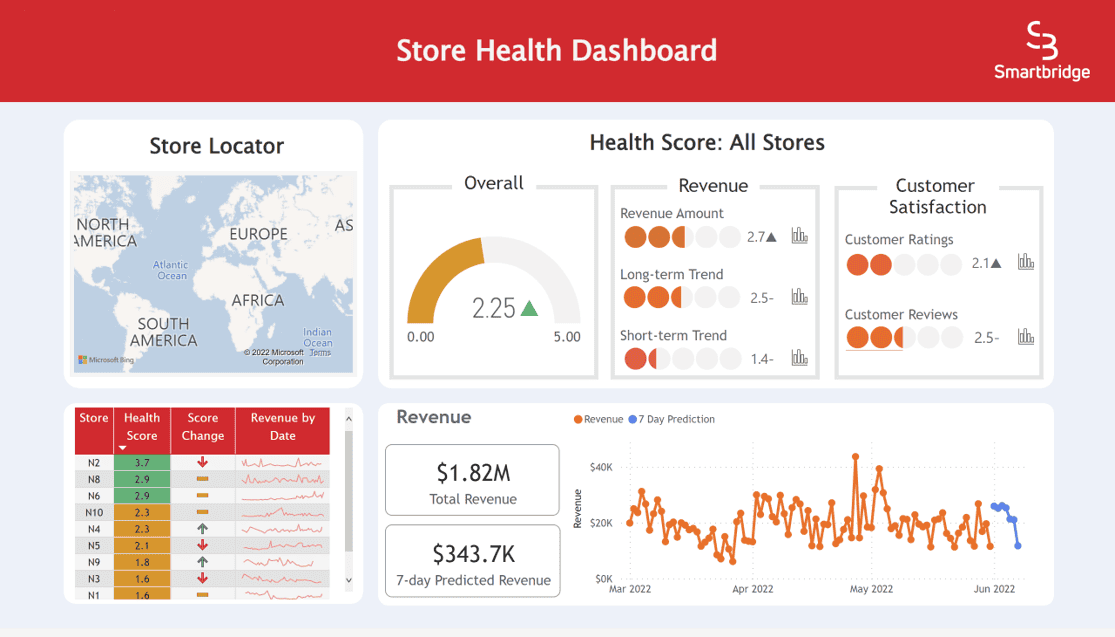
Now that you have your data available, you need to start by creating measures. For a sales dashboard, you might use measures such as Total Sales, Customer Satisfaction, Total Orders, and Revenue Growth. Once you have your dimensions and measures, you can start building out the visualizations that will allow you to understand the data much more easily.

6. Publish to the Service
For this step you will be uploading the development from your desktop to the web service. You will need to choose a workspace in which your report and dataset will reside.
7. Create a Gateway and Schedule Refresh
Keeping data fresh is always a priority, creating a gateway gives Power BI the ability to query on-premise databases, files, and other sources. Once the gateway is built, schedules can be created.
8. Share with Others
Now that your development is on the service, you can share your insights. Power BI has many ways to share. Some of them are:

Smartbridge is a Microsoft Power BI Partner
Enhancing Productivity with Copilot in Power BI
Microsoft Power BI also includes the Copilot feature, an AI-driven assistant designed to enhance your productivity. Copilot can help you generate reports, create data models, and provide insights more quickly by automating repetitive tasks and offering intelligent suggestions. This allows users to focus on deeper data analysis and strategic decision-making.

With Power BI, you’ll be able to create powerful models and visuals with data that you’ve collected for any situation. This will allow your organization to better analyze a situation and take the proper steps to mitigate risks, resolve issues, and make informed decisions to best fit the needs of the company.
Keep Reading: Power BI – An Optimal Self-Service BI Tool
There’s more to explore at Smartbridge.com!
Sign up to be notified when we publish articles, news, videos and more!
Other ways to
follow us:


