PART 1
ESG Data Analytics: Getting Started with ESG Reporting for Environmental Compliance
This article (Part 1) will set the stage for planning your Environmental, Social and Governance (ESG) data analytics and reporting. A Proof of Concept will assist in finding areas where broad strokes provide the information you need, while others will require refined data for a more robust model.
Applying ESG Data Analytics to meet internal and external ESG targets
People have always talked about the weather. We’ve observed it, planned for it, planned around it, and frequently, have cursed it. It is a collection of forces ranging from beautiful and restorative to terrifyingly destructive.
Now, we are being asked to influence it.
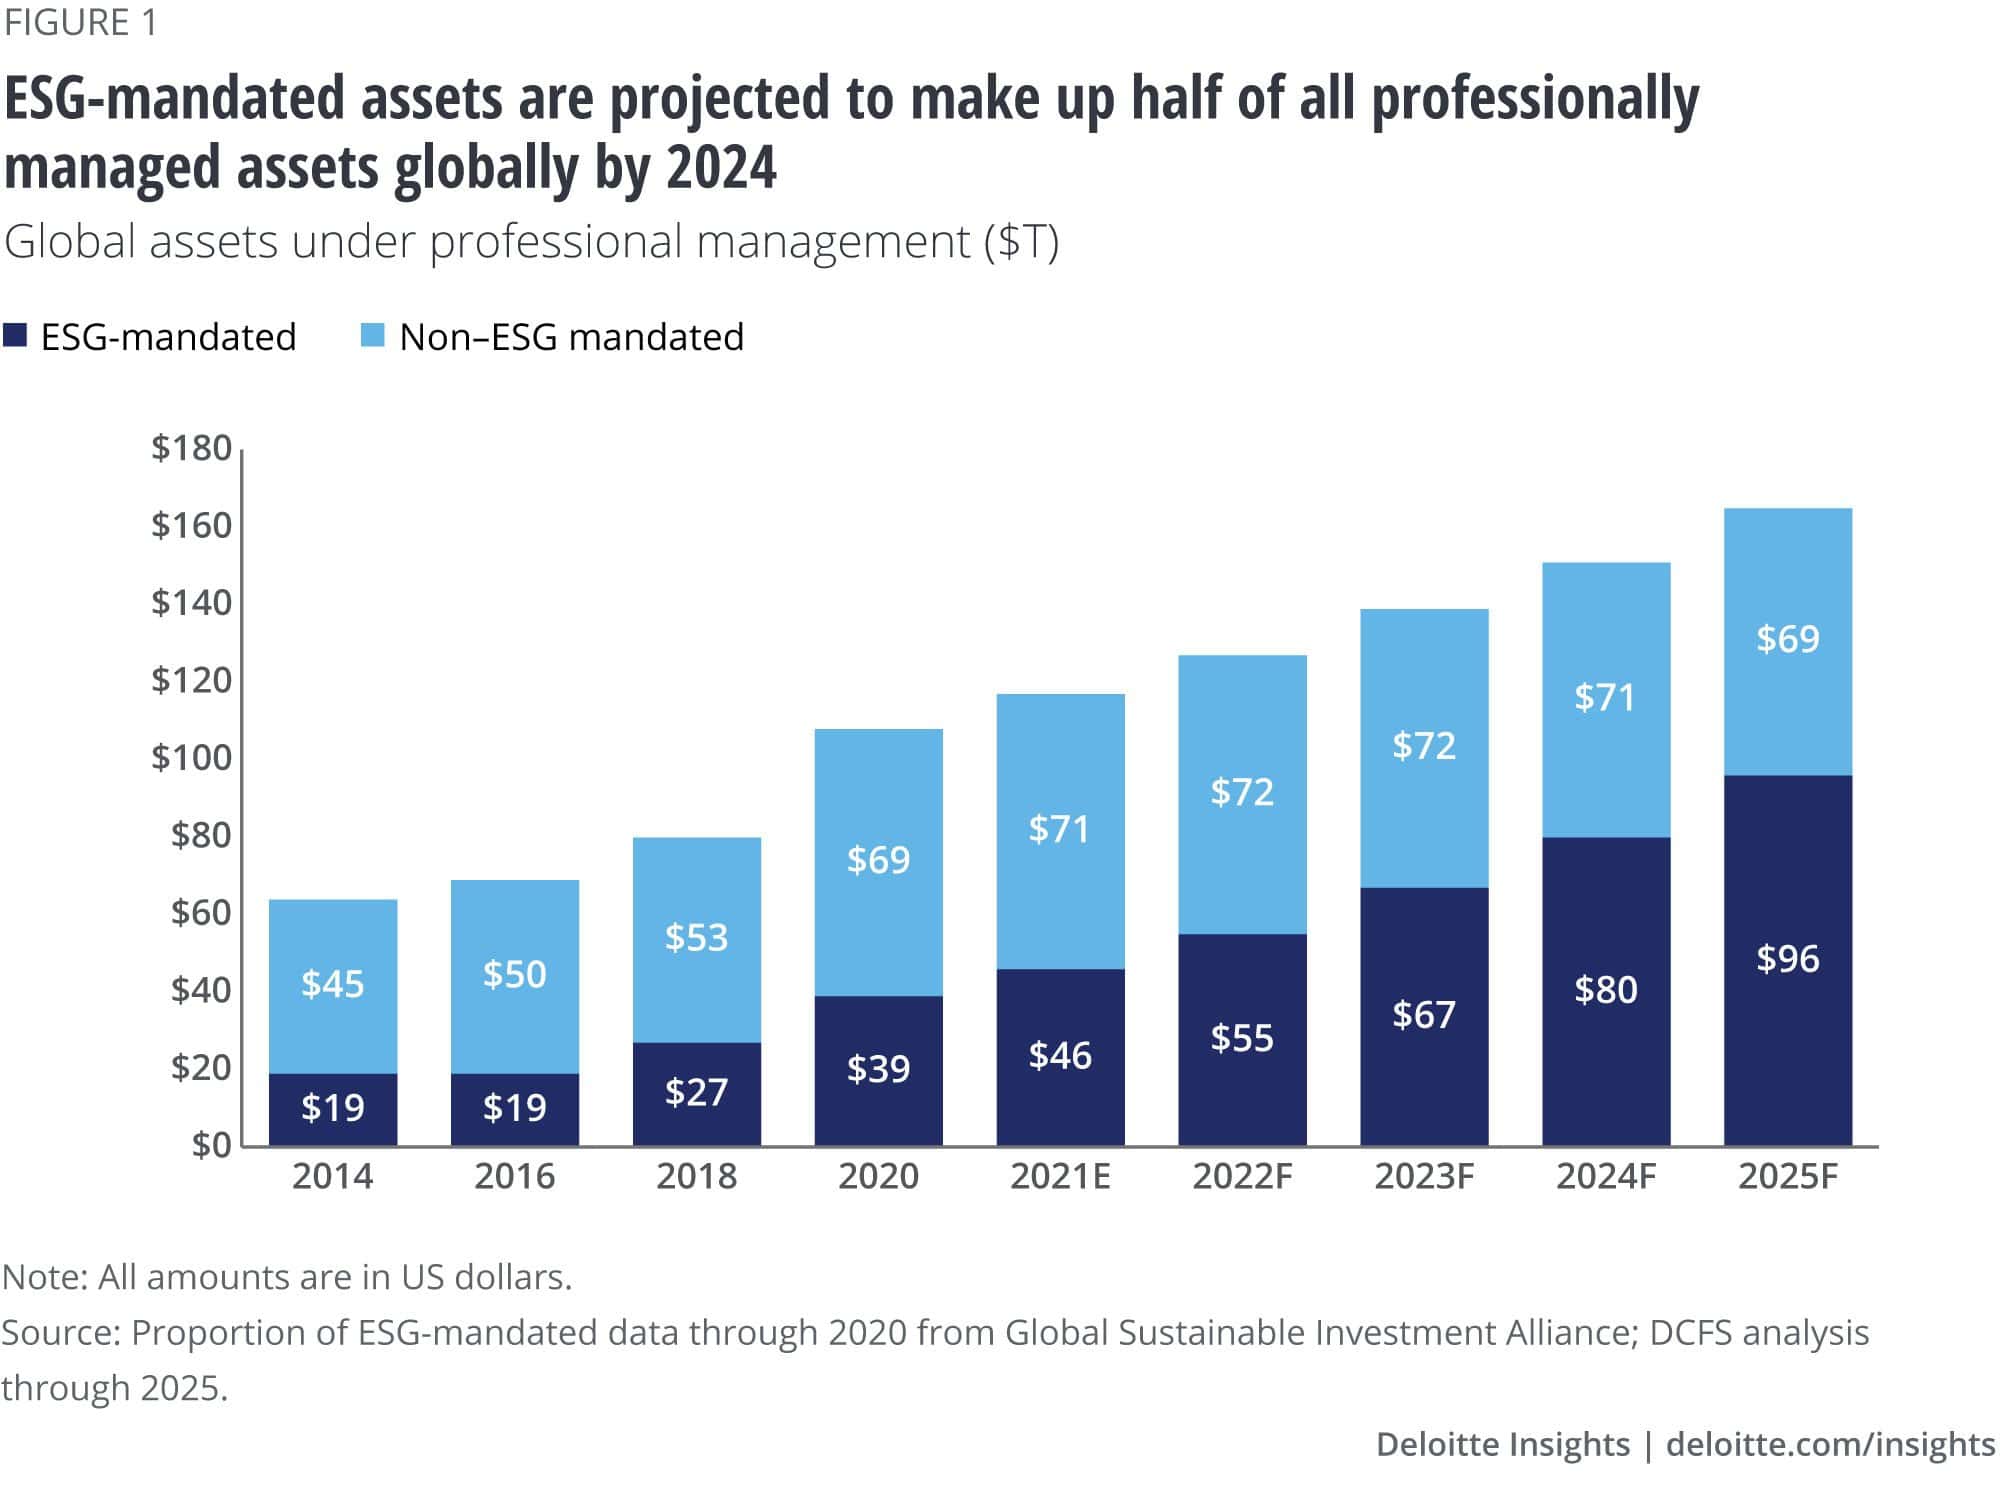
As a result of the Paris Climate Accord signed in 2015, we are being tasked with meeting a series of time-adjusted climate goals. This has given rise to a dramatic increase in spending on Environmental, Social, and Governance, also known as ESG. It’s a mix of goals that have become increasingly more important and have even proven profitable. Since we now have Paris (Climate Accord), let’s look at the “environmental” piece of ESG.

Image courtesy of Deloitte Insights (source)
There is already an alphabet soup of standards organizations to measure environmental performance across a vast range of industries. There’s CRREM (Carbon Risk Real Estate Monitor), EPEAT (Electronic Product Environmental Assessment Tool) for electronics, MSC (Marine Stewardship Council) for sustainable seafood, SAC (Sustainable Apparel Coalition) for apparel and footwear, etc. Then, there are cross-industry standards like ISO 14001 (Environmental Management System), the SASB (Sustainability Accounting Standards Board) or the TCFD (Task Force on Climate-related Financial Disclosures) for ESG reporting. Many companies are being forced to be environment-friendly by their shareholders; they are working very hard to meet or exceed these standards and shareholder expectations.
This is where our work comes in. Whether it is a recognized standard or a corporate goal to exceed it, we must make it happen. These are not small goals, and the solutions are complex. At Smartbridge, we are working with our clients to create solutions with ESG data analytics to enable them to meet their internal and external ESG targets. Let’s examine the process involved and how to get started.
The 3 Scopes of Emissions
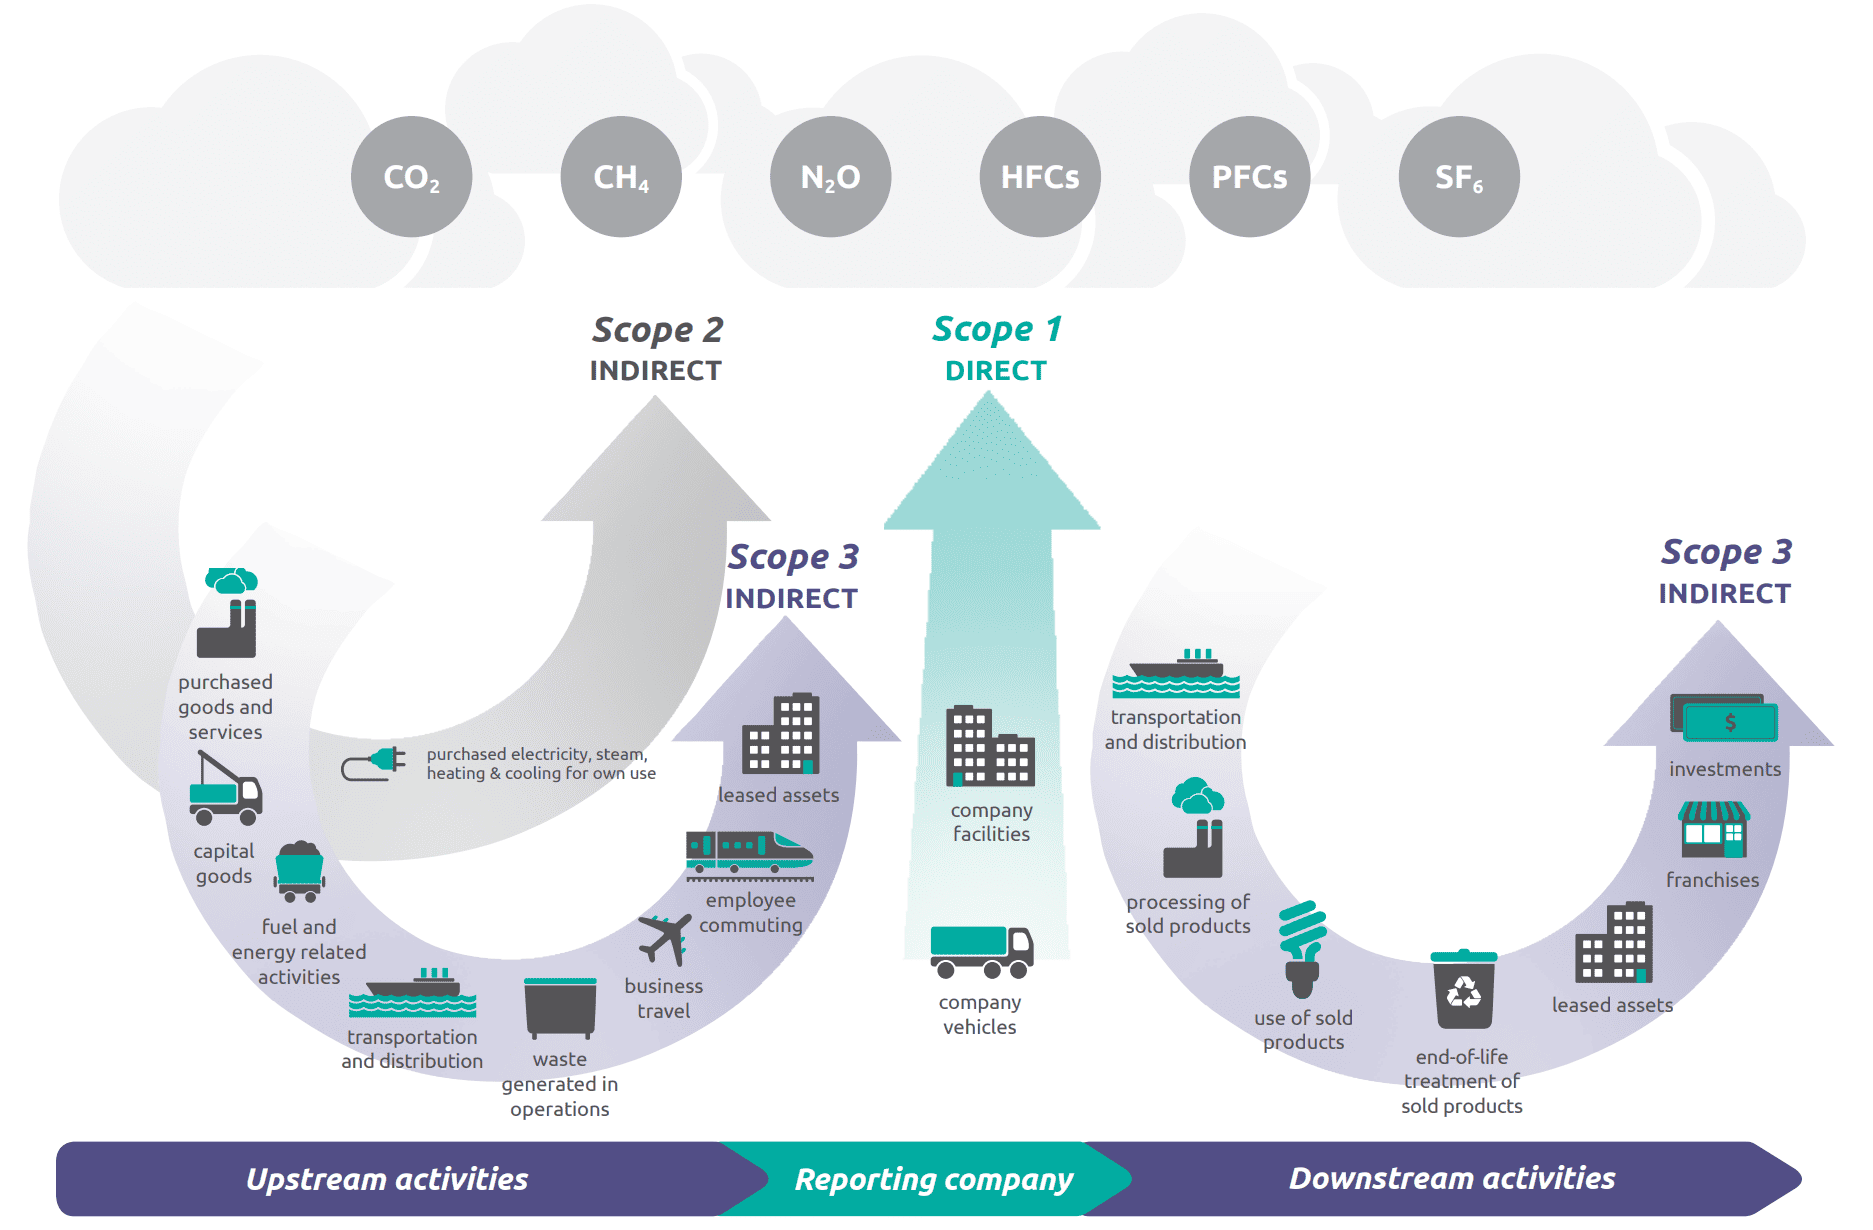
The Greenhouse Gas (GHG) Protocol, which is used in carbon reporting, defines three main scopes. The EPA defines these as the following:
For this discussion, let’s focus on Scopes 1 and 2 since these are within your control, while Scope 3 depends on 3rd parties. If you are a vendor or service provider for other businesses, the data you collect for your own reporting will then fulfill Scope 3 for your customers. Having this carbon reporting data available for your customers will become a competitive advantage as they work through this process, too.

Overview of GHG Protocol scopes and emissions across the value chain
Source: WRI/WBCSD Corporate Value Chain (Scope 3) Accounting and Reporting Standard
Understanding the Requirements
Start with the reporting requirements as defined in the standards documentation. Since the standards are broadly written, it will take some time to narrow down the scope to what applies to your specific needs. These should then be reviewed within your company, which will likely result in more aggressive goals in order to leave a margin for external circumstances.
Identifying the Needed Data for ESG Data Analytics Reporting with a Proof of Concept
With these requirements, we can build a model to estimate emissions over time. This will be an iterative process that includes a cross-section of interested parties across your company, so think big. Try to envision the entire scope in broad strokes. Understand what assets will need reporting, what kind of data can be expected from them, and what actions have been scheduled that may change the data. Then, we start small by mocking up realistic data to run through the model, review the results, and then iterate.
Throughout this process, list what types of data are required in different areas for the calculation. For real estate, this may include geographic location, square area, usage types, utility types and quantities, etc. The resulting model gives you the basis for understanding your situation “as-is” and can then be used to project what “could be”. This is your Proof of Concept (PoC), and you will find that in some areas, broad strokes provide enough information, while others will require more refined data for a more robust model. At its core, this PoC is giving you the information that you need for reporting, and you have discovered what data is needed to feed it.
Now, we need to acquire the data.
Keep Reading: Part 2: Build Your ESG Data Model
There’s more to explore at Smartbridge.com!
Sign up to be notified when we publish articles, news, videos and more!
Other ways to
follow us:


