PART 2
Getting Started with ESG Data & Analytics: Create Your ESG Data Model
In part 1, we looked at the looming environmental goals faced by our companies. We built a Proof of Concept (PoC) with a sample of relevant data. Now, we will investigate acquiring actual values to feed our ESG data model.
4 Steps towards your ESG data model
1. Assess Your Available Data
Large organizations have assets that are spread across the country and the world. Data availability can vary significantly across vendors in one city – the wider the range of sources, the more complex it becomes. You need to look at the model data and try to match it with the information you have on hand.
Many systems may already have some of the basics required, like a database of locations with addresses. You may have the square area but not broken out by usage. What will it take to get the essential data that you need? Look for gaps and then look for ways to fill them.
2. Getting More Data for your ESG Data Model
Once you know what you currently have, you can work to acquire data to fill in the gaps.
Some of the data may be available, but it is manually reported. Can this be automated? Is the data available from the vendors, like a bill or report on monthly electricity or gas usage? How would we get this data? Can we automate the data collection through integrations with vendor systems? In the short term, can we build an application for manual data collection? How soon can these solutions be delivered?
As you see, this process can result in many additional smaller projects for process and systems enhancement.
3. Planning Ahead
All these activities enable us to collect the data we need, estimate where things are going as-is, and allow us to report the required emissions data. That’s quite an accomplishment in itself! Now you know where you are. Let’s look at how to get to where you want to go.
This point of the carbon emissions reporting and goals is for companies to be transparent and proactive in making changes for a positive environmental impact. This means change, but what do you change?
Based on your current data, your model shows you what the future looks like. There is likely work to be done to meet the goals within the established timelines. Here is where we start improving our model. We can add additional data to work out “what if” scenarios that will help us not only look at carbon emissions but also help us keep budget constraints in mind.
What actions can be taken?
In the case of a building, solar panels could be installed, or old insulation replaced.
How long do these projects take?
What is the total cost and the cost per year?
What impact will they have on our projections?

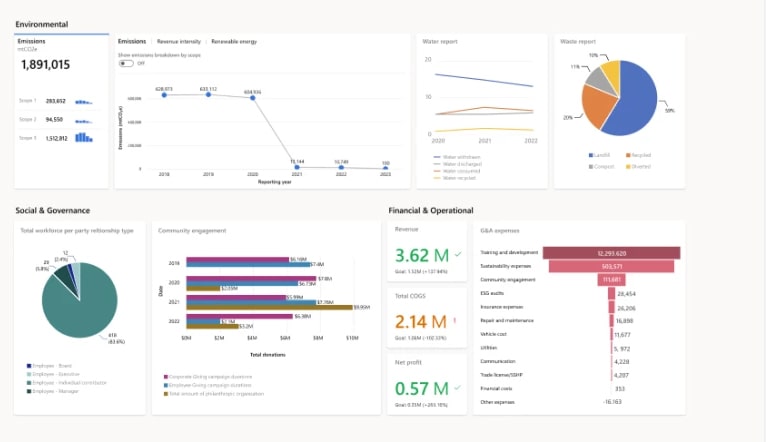
Integrated environmental, social, and governance data from various source systems, standardized to build a centralized ESG data estate in Microsoft’s new Project ESG Lake. (source)
The model can be expanded to try different combinations of actions over different time periods. This can provide you with an optimized plan for an asset to reach its goals, but you can also do this in aggregation across all assets. This is a more significant enhancement to the model, but it can lead to greater savings overall. Merely looking at optimized actions for each asset in isolation most likely won’t give you the optimal path for the entire organization. So, we look at all these actions together to make sure they meet our other constraints, like the annual budget for improvements, staffing and other resource constraints, potential retraining and hiring, or vendor selection. All these factors are vital for planning, and our model should be designed with this in mind.
4. Validate and Adjust
Most of this article focuses on acquiring, modeling, and using data, but this was all done to see real results. So, we must also include measuring the results.
Our model got us started, but it shouldn’t be stagnant. As real projects are completed, new data should be fed into the model.
How much did the solar panel project actually cost? How long did it take? What is the measured improvement in electricity cost and carbon emissions (was there one)?
This is new data that informs our model and helps us to adjust it to align expectations with reality. This (hopefully) increases your confidence in the solutions you are putting in place and that your model is providing valid predictions, which is vital when reporting to customers, other agencies, and shareholders.

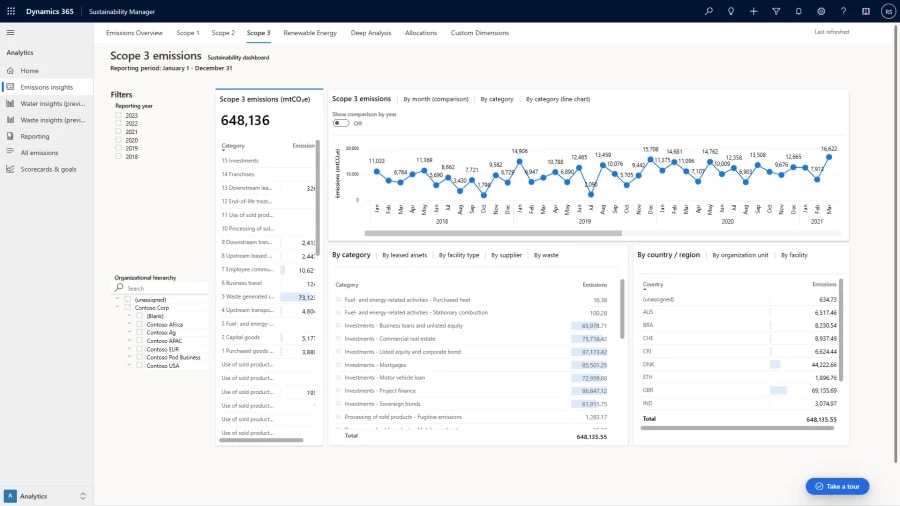
Stage 3 emissions in Microsoft’s new Project ESG Lake. (source)
Wrapping up on ESG Data Models
While it may sound straightforward, this is not an overnight process. Some of the goals seem distant, but we are already running late! The improvements take time, and you can be assured that it will be harder and harder to find companies to do the work when there is a rush as we get closer to the deadlines. Availability will be tight, and costs will increase as more companies vie for the same vendors and resources.
The goals have been established, and you already have at least some of the data that you need. Start the process. Feeding all this data may require digital maturity and robust data management capabilities. ESG reporting is becoming more and more critical to our clients, our shareholders, and the world. I hope this article has provided you with some of the first steps on this journey.
Keep Reading: ESG kWh Tracking Automation for an Energy Company
There’s more to explore at Smartbridge.com!
Sign up to be notified when we publish articles, news, videos and more!
Other ways to
follow us:


