

Data Done Right: 6 Dimensions of Data Quality
Improving data quality is much more than “clearing” out bad data; it’s a dedicated process that involves considering all aspects of your collection process. We’ll explain how data quality can decrease over time, and the six dimensions to consider when determining “bad” data.
Data quality dimensions are the six measurable criteria that determine whether your data is fit for business use: accuracy, completeness, consistency, timeliness, validity, and uniqueness.
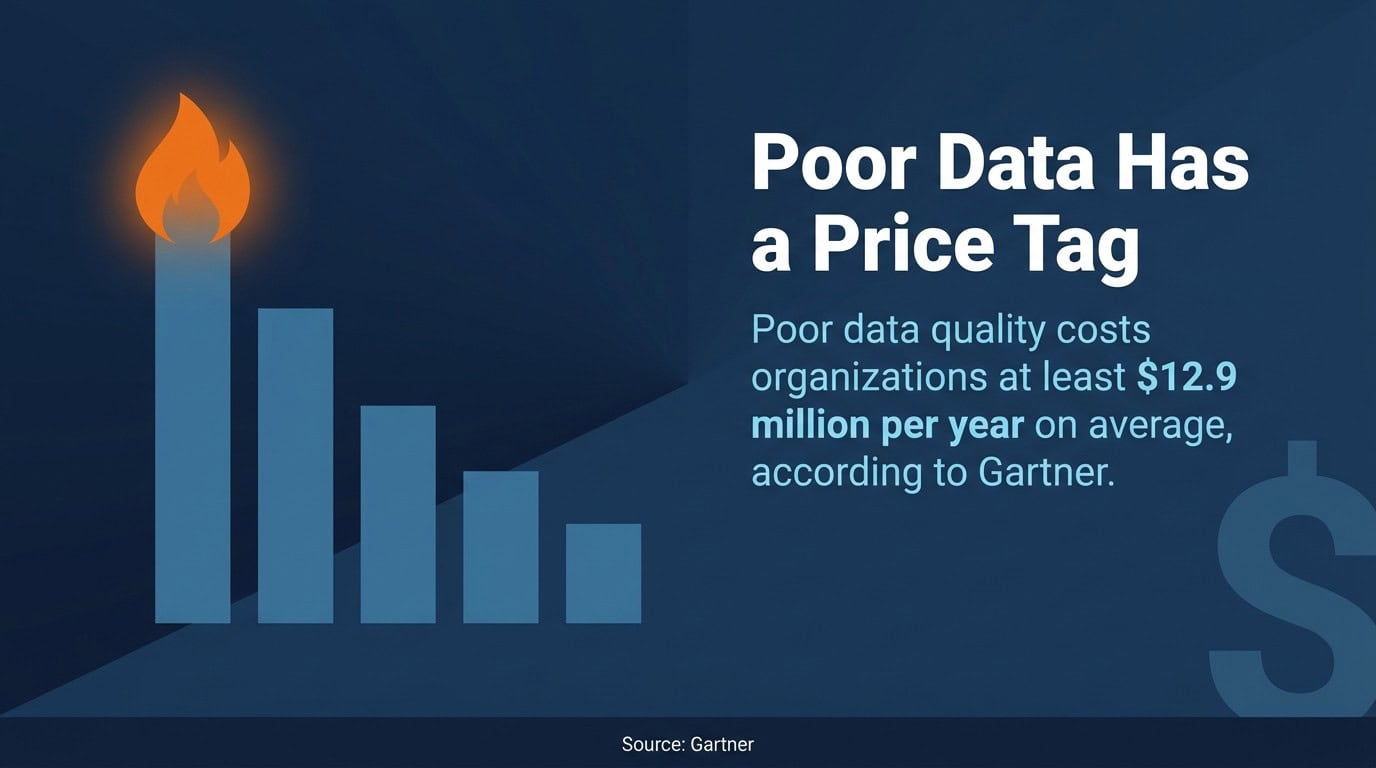
Poor data quality costs organizations at least $12.9 million per year on average, according to Gartner’s data quality research. Each dimension targets a different failure mode, and ignoring even one of them compounds the rest. Organizations that want reliable AI, trustworthy reporting, and operational efficiency need all six working together, not just the ones that are easiest to measure.
Most teams treat data quality as an IT problem, but it isn’t. It’s a business problem that lives in your CRM, your EHR system, your financial reporting stack, and every pipeline feeding your AI models. We’ve spent over 22 years watching organizations chase symptoms while the root cause sits untouched in their data foundation. This guide names the dimensions, shows how each one breaks in the real world, and tells you exactly how to measure and fix them.
What Are Data Quality Dimensions?
Data quality dimensions are a structured set of criteria used to evaluate whether data is accurate, complete, and fit for its intended purpose within an organization. They give data teams and business leaders a common language for diagnosing data problems, setting quality thresholds, and measuring improvement over time.
The framework has academic roots. In 1996, researchers Richard Wang and Diane Strong published a foundational study that classified data quality into categories based on what data consumers actually cared about. Their work shaped how the industry, including frameworks like DAMA’s Data Management Body of Knowledge and ISO 8000, approaches data quality today.
The most widely adopted set covers six core data quality dimensions: accuracy, completeness, consistency, timeliness, validity, and uniqueness. Some frameworks add integrity, relevance, or accessibility as additional dimensions. The six-dimension model is the practical baseline for most enterprise data governance programs, and it’s where every organization should start.
Each dimension answers a different question about your data. Together, they form a complete picture of data health. Measured individually, they pinpoint exactly where your data foundation is failing and what it’s costing you.
The 6 Core Data Quality Dimensions (Plus Additional Dimensions to Consider)
The six core data quality dimensions each address a distinct way that data can fail a business. Most organizations score poorly on at least two or three, and the damage compounds when multiple dimensions fail at once. Harvard Business Review research found that only 3% of companies’ data meets basic quality standards, and on average 47% of newly created data records contain at least one critical error. That number should stop anyone cold. Nearly half of your new data is wrong before it’s even used.

Like we mentioned before, beyond the core six, organizations with mature data programs often track additional dimensions like data integrity, relevance, and accessibility. We’ll cover integrity in detail alongside the core six, because in enterprise environments it’s too important to treat as optional. The sections below follow a consistent structure: definition, where it breaks in the real world, how to measure it, and how to fix it. Work through each one and you’ll have a clear baseline for your data quality program.
1. Accuracy: Does Your Data Reflect Reality?
Data accuracy measures how closely data values match the real-world entities or events they represent. A customer record showing the wrong shipping address, a sensor reading that drifts 15% from actual output, or a product price that hasn’t updated since last quarter are all data accuracy failures. The data exists, but it isn’t correct.
Data accuracy failures are expensive precisely because they’re invisible until something breaks. A sales rep calls a prospect using the wrong company name from a stale CRM record. A physician prescribes medication based on a patient weight recorded in the wrong unit. A financial report misstates revenue because source data was manually keyed incorrectly. Each failure traces back to the same root: data that doesn’t reflect reality.
How to Measure Data Accuracy
Measure data accuracy by comparing data values against a trusted reference source. For customer addresses, that reference might be a postal verification API. For financial transactions, it’s the source ledger. For sensor data, it’s a calibrated instrument reading taken at the same time.
The standard data accuracy metric is: (Number of accurate records / Total records) x 100. Set a threshold based on the risk your use case can tolerate. A marketing email list might accept 95% accuracy. A patient medication record needs to be closer to 100%.
Improving Data Accuracy
Address data accuracy at the point of entry first. Validation rules at data entry, address standardization APIs integrated into your CRM, and automated cross-checks against reference datasets all catch errors before they propagate downstream. For historical data, run profiling tools to identify outliers and anomalies, then prioritize correction based on business impact.
Build data accuracy into your data governance policies. Assign data stewards who own specific domains and are accountable for accuracy metrics. Without ownership, accuracy problems stay invisible until a decision goes wrong.
2. Completeness: Is All Required Data Present?
Data completeness measures whether all required data is present and available for use, with no missing values in fields that matter for a given process or decision. An incomplete record isn’t necessarily inaccurate. It’s just missing information that the use case depends on.
Missing values are one of the most common data quality problems enterprises face, and they surface differently depending on the domain. A CRM contact with no email address can’t receive a marketing campaign. A product record without a cost field breaks a margin calculation. An insurance claim with missing diagnostic codes delays processing or triggers manual review. In each case, the record exists but fails its purpose.
How to Measure Data Completeness
Calculate data completeness as: (Number of non-null values for a required field / Total expected records) x 100. Run this calculation at the field level, not just the record level. A record can appear complete while hiding missing values in specific fields that only certain processes need.
Distinguish between two types of missing values: those that are structurally absent (a field that was never collected) and those that are conditionally required (a field that only applies under certain conditions). Treating them the same inflates your completeness score and masks real gaps.
Improving Data Completeness
Require mandatory fields in data collection forms and intake processes. That sounds obvious, but most organizations have dozens of optional fields that critical downstream processes depend on. Audit your pipelines to identify which fields are actually required for each use case, then enforce collection at the source.
For historical gaps, decide whether to back-fill from other sources, flag records as incomplete for downstream processes to handle, or exclude them from specific analyses. Each approach is defensible. The mistake is treating incomplete records as complete ones.
3. Consistency: Does Your Data Agree Across Systems?
Data consistency measures whether the same data attribute holds the same value across multiple systems, datasets, or representations at a given point in time. Inconsistent data means your CRM says a customer is active, your billing system shows them as lapsed, and your support platform has them marked as churned. All three are wrong about each other, and none of them agree on the truth.
Data consistency problems multiply in proportion to the number of systems in your environment. The more integrations, the more opportunities for values to diverge. And they do diverge. A field name that means one thing in Salesforce means something slightly different in your ERP. A date format that uses MM/DD/YYYY in one system uses YYYY-MM-DD in another. Over time, these small inconsistencies compound into contradictions that make cross-system reporting unreliable.
How to Measure Data Consistency
Compare field values for the same entity across systems. Pick a reference dataset (usually the system of record) and measure the percentage of records where all downstream systems agree. Flag records where values diverge beyond acceptable thresholds.
Also check for format consistency within a single dataset. Phone numbers stored in four different formats, state codes mixed with full state names, and currency values with inconsistent decimal handling are all consistency failures within a single system.
Improving Data Consistency
Establish a single system of record for each key data domain: one authoritative source for customer master data, one for product data, one for financial reference data. All other systems consume from that source. This is master data management in practice, and it’s the most direct fix for chronic data consistency failures.
Standardize formats at ingestion. When data enters your environment from external sources or integrations, transform it into your canonical format immediately rather than letting inconsistent formats accumulate. This is exactly the kind of structured, purposeful approach that separates a real data foundation from a patchwork of system-level workarounds.
4. Timeliness: Is Your Data Available When Needed?
Data timeliness measures whether data is available within the timeframe required for its intended use, with freshness sufficient to support accurate decisions. Stale data is accurate data that has aged past its usefulness. A price feed that’s 20 minutes old is fine for a weekly report. It’s a serious problem for a real-time trading system.
Timeliness is the dimension most directly tied to pipeline architecture. If your data warehouse refreshes nightly and a decision-maker needs same-day figures, you have a timeliness failure regardless of how accurate or complete the data is. The data quality problem and the infrastructure problem are the same problem.
How to Measure Data Timeliness
Define timeliness requirements for each use case before measuring. “How fresh does this data need to be?” is a business question, not a technical one. Once you have the requirement, measure it as the difference between when data was generated and when it was available for use, compared against the threshold.
Track data latency at each stage of your pipeline: ingestion lag, transformation time, load time, and propagation to downstream systems. Latency problems compound across stages, so measuring end-to-end freshness without stage-level visibility makes root cause analysis nearly impossible.
Improving Data Timeliness
Match your pipeline architecture to your timeliness requirements. Not every dataset needs real-time streaming. But the ones that do need it should have it. Audit your refresh schedules against the actual business decisions each dataset supports. You’ll almost certainly find datasets refreshing far less often than the decisions they’re feeding require.
Build timeliness SLAs into your data governance framework. Assign ownership, set thresholds, and alert when data exceeds acceptable latency. Timeliness without a defined threshold is just a guess about freshness.
5. Validity: Does Your Data Conform to Defined Rules?
Data validity measures whether data values conform to defined formats, ranges, types, and business rules established for a given field or dataset. Invalid data passes the completeness check (the value is present) and may even pass a surface-level accuracy check, but it violates the rules that make data usable in a given context.
A date field containing “February 30” is invalid. An email field containing “john.doe” without a domain is invalid. An age field containing -5 is invalid. These values exist in the dataset, but they can’t be used correctly by any downstream process that relies on them conforming to their defined format or range.
How to Measure Data Validity
Define validity rules for each field: data type, allowed format, value range, reference list, or business rule. Then measure the percentage of records where each field’s value satisfies its rule. A field with a 92% validity rate means 8% of values are unusable by processes that enforce the rule.
Validity rules come in two categories. Format rules are structural (a US phone number has 10 digits, a ZIP code is 5 or 9 digits). Business rules are contextual (a shipment date cannot precede an order date, a discount percentage cannot exceed 100). Both matter, and both need explicit definition before you can measure compliance.
Improving Data Validity
Enforce validity rules at data entry with input masks, dropdown constraints, and real-time validation feedback. Catching invalid values before they enter your system is dramatically cheaper than correcting them after they’ve propagated through three downstream tables.
For existing datasets, run a validity profiling pass to identify which fields have the highest invalid value rates and which business processes depend on them. Fix the intersection of high-invalidity fields and high-criticality processes first. That’s where the business impact is concentrated.
6. Uniqueness: Is Every Record Distinct?
Data uniqueness measures whether each real-world entity is represented exactly once in a dataset, with no duplicate records that would distort counts, inflate metrics, or trigger redundant actions. Duplicate records are one of the most operationally damaging data quality problems in enterprise systems, and they’re also one of the most underestimated.
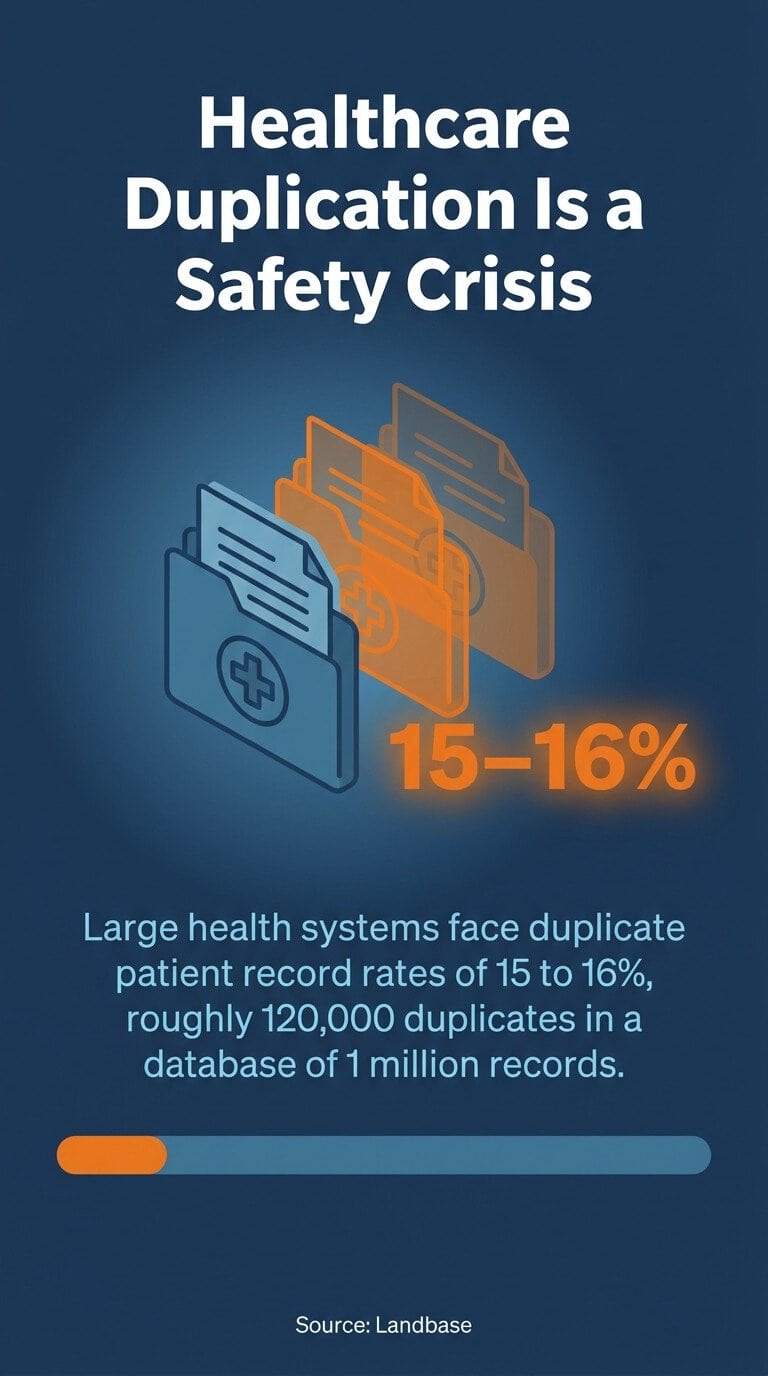
The healthcare sector shows just how severe duplication gets at scale. Large health systems face duplicate patient record rates of 15 to 16%, which translates to roughly 120,000 duplicates in a database of 1 million records, according to duplicate record rate statistics from Landbase. A patient with two records may receive duplicate lab orders, miss medication reconciliation, or have care gaps that no one notices because different providers are looking at different records. In healthcare, duplicate records aren’t just an analytics problem. They’re a patient safety problem.
How to Measure Data Uniqueness
Calculate uniqueness as: (Total records – Duplicate records) / Total records x 100. But “duplicate” requires a definition. Exact duplicates (identical primary keys) are easy to find. Fuzzy duplicates (same customer, slightly different name or address spelling) require probabilistic matching algorithms that compare across multiple fields.
Use data profiling to identify both types. Exact duplicate detection is a basic SQL query. Fuzzy duplicate detection requires tools with record linkage or deduplication capabilities, like those available in Microsoft Fabric or Salesforce Data Cloud.
Improving Data Uniqueness
Deduplication is a two-step process: find duplicates, then resolve them. Finding is the technical step. Resolving is the governance step, because merging records requires rules about which value wins when two records disagree.
Prevent new duplicates by implementing match-and-merge logic at data entry. When a new record is created, check it against existing records before committing. A match above a confidence threshold triggers a review or automatic merge rather than creating a new record. Building this into your intake process is far less costly than running periodic deduplication campaigns after the fact.
Data Integrity and Additional Dimensions Worth Tracking
Data integrity is a dimension that extends beyond the core six and addresses whether data maintains its correctness and relational consistency across system transfers, transformations, and database operations. Where data accuracy asks whether a value is correct, data integrity asks whether values remain correct and properly linked after data moves between systems.
Referential integrity is the most common form. If a customer record is deleted but their order records still reference it, those orphaned orders have an integrity violation. The data may have been accurate before the deletion. After it, those records are corrupted.
Data integrity failures are particularly costly in regulated industries. Non-compliance with general data processing principles was the second-most-cited cause of GDPR fines as of February 2025, with 629 enforcement cases, according to Statista’s GDPR enforcement data. Much of that non-compliance traces back to data integrity failures: personal data processed without proper records of lawful basis, inconsistently applied retention rules, or data transferred between systems without maintaining required attributes.
Other dimensions worth adding to a mature data quality program include relevance (does the data apply to the problem at hand?), accessibility (can the right people get to it when they need it?), and precision (does the data contain sufficient detail for the required analysis?). These don’t displace the core six. They extend them for organizations whose data quality programs have already gotten the fundamentals right.
Why Data Quality Dimensions Drive Business and AI Outcomes
Data quality dimensions are the foundation that determines whether your business decisions, operational processes, and AI initiatives produce reliable results or expensive failures.
The financial exposure is direct. Over a quarter of organizations estimate they lose more than $5 million annually due to poor data quality, and 7% report losses exceeding $25 million, according to IBM’s analysis of poor data quality costs. This is the accumulated cost of decisions made on wrong data, duplicate records that trigger redundant shipments, stale data that produces misleading reports, and invalid data that breaks automated processes.
The AI dimension compounds the stakes. AI models trained on inaccurate, incomplete, or inconsistent data learn the wrong patterns. They produce plausible-looking outputs that are subtly wrong, and those errors propagate at machine speed into every system the model feeds.
This is exactly why we tell clients: you can’t build a reliable AI program on a patchwork data foundation. The model is only as good as the data it learned from. Get the data quality dimensions right first, and your AI investment has a real foundation to build on. Skip that step, and you’re feeding a sophisticated system with unreliable inputs.
Data Quality Dimensions and Data Governance
Data quality dimensions give your data governance program its measurement layer. Governance without metrics is just policy. Policy without enforcement is just aspiration. When you define target thresholds for each data quality dimension, assign data stewards who own specific domains, and build dashboards that surface dimension scores against those thresholds, you’ve turned a governance framework into an operating system.
Your data governance policies should specify which data quality dimensions apply to each data domain, what the acceptable threshold is for each, who is responsible for corrective action when a threshold is breached, and how often scores are reviewed. Data quality metrics built around these six dimensions give that structure real teeth.
Implementing Data Quality Dimensions in Practice
Start with a data profiling baseline across your most critical datasets. Most organizations are surprised by what profiling reveals. Fields they assumed were complete turn out to have 20% null rates. Records they assumed were unique turn out to have a 5% duplicate rate. You can’t improve what you haven’t measured.
Prioritize by business impact, not dimension. A completeness gap in a low-traffic reference table is a lower priority than an accuracy problem in your financial close data. Map each dimension failure to the downstream process it disrupts and the cost of that disruption. Fix in that order.
Build data quality checks into your data and analytics pipelines as automated gates, not manual reviews. A pipeline that catches a validity violation before it loads into your warehouse is far cheaper than a pipeline that surfaces the violation three weeks later in a board report.

Finally, connect your data quality metrics to your data governance scorecard. Share dimension scores with business stakeholders, not just the data team. When the VP of Operations can see that the customer address completeness rate dropped from 97% to 91% last quarter, data quality stops being an abstract IT metric and becomes a business problem with a named owner.
Data Quality Dimensions as Your AI Readiness Checklist
Every AI and machine learning initiative your organization runs depends on data that passes the six data quality dimension tests. An ML model trained on inaccurate labels learns inaccurate patterns. A recommendation engine fed incomplete user profiles makes incomplete recommendations. A forecasting model built on inconsistent historical data produces inconsistent forecasts. The dimension failures don’t disappear inside the model. They get amplified.
Use the six data quality dimensions as a pre-flight checklist before any AI initiative goes into production. If your training data scores below acceptable thresholds on accuracy, completeness, or consistency, address the data foundation before tuning the model. A model retrained on clean data will outperform a heavily tuned model trained on poor data, every time.
The security angle also matters. Data integrity failures and poor data governance are contributing factors in many breaches, because systems that don’t maintain proper data integrity often have gaps in access control and audit trail maintenance as well.
Ready to make your data ready for what’s next? Talk to a Smartbridge expert and start with a data foundation assessment that tells you exactly where your data quality dimensions stand today.