Power BI – An Optimal Self-Service BI Tool
A modern self-service business intelligence approach means providing transparency and access to information, not only for management but also for business users. Power BI as a self-service BI tool can give your organization the capabilities it needs to empower your employees to make informed business decisions.
Business users today expect more than dashboards. They want answers, context, and confidence in their data. Power BI, now part of the Microsoft Fabric ecosystem, continues to deliver on the promise of self-service business intelligence by combining accessibility with enterprise-grade governance.
As Fabric brings together data engineering, data science, and analytics in a unified platform, Power BI’s role has evolved from a reporting tool to the semantic and visualization layer of a broader analytics architecture. This modern stack enables organizations to scale insights across teams while maintaining a single source of truth through governed semantic models.
The Evolution of Modern Self-Service Business Intelligence
A few years ago, the ability to make data-driven decisions based on business intelligence (BI) was mostly limited to top management. Traditionally, IT owned the entire BI pipeline from data extraction to dashboard creation. As organizations matured, they recognized the need for business-led exploration supported by central governance. A lot of factors complicated this traditional BI approach, especially when it came to other business users in the company:
Today, self-service BI is defined by AI-assisted exploration, semantic consistency, and cross-domain collaboration. Tools like Power BI within Microsoft Fabric now help balance autonomy and control, allowing users to ask questions in natural language, build reports from trusted semantic models, and share insights securely across the enterprise.
Modern self-service BI has taken much of the burden from IT departments and has put the power in hands of the business users. This creates a cost-effective and efficient BI space with more valuable insights than ever before. If implemented correctly, self-service BI can bring great value to a company and boost its performance.
This self-service BI movement has been clear to see on the projects we’ve worked on at Smartbridge. Organizations aren’t just focused on building good reports that deliver insights, but are wanting to get data into the hands of their team members/employees.
Power BI and Microsoft Fabric: A Unified Analytics Platform
Like we mentioned before, Power BI is now a core experience within Microsoft Fabric, the unified data platform that integrates data engineering, data warehousing, data science, and real-time analytics into a single environment.
Within Fabric:
This architecture ensures one set of definitions, one layer of governance, and one connected user experience, whether teams build dashboards, train models, or interact through AI copilots.
Power BI as a Self-Service BI Tool
Power BI is a data analytics software and application package offered by Microsoft. It is a user-friendly tool that allows users to quickly analyze information they need and share it within their business network. Additionally, it is powerful enough for advanced users to perform high-level analytics as needed. The package lets you assess your data and offers the following capabilities:
Why Use Power BI?
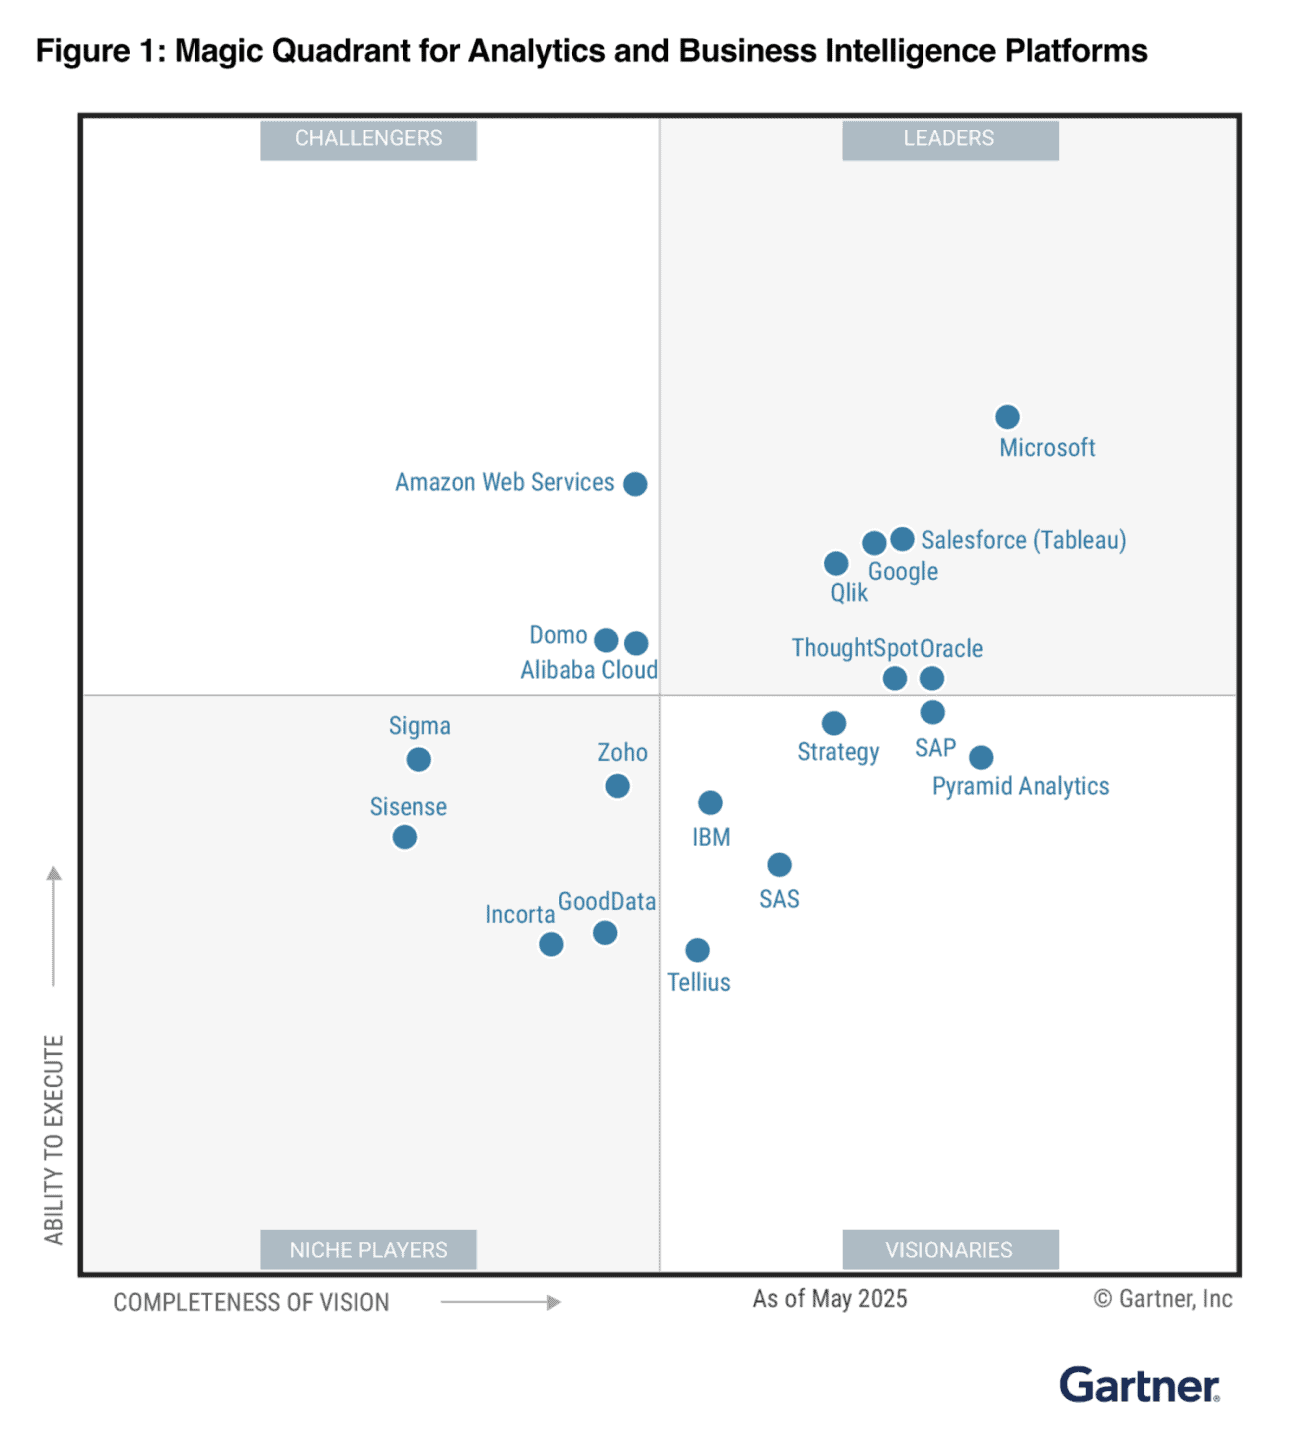
Every business intelligence tool is different with varied features to assist organizations in meeting their business needs. Of course, it depends on what is important for your company. Here are a few reasons why Power BI is the industry leader and a great option:
Daily Power BI Reports That Business Users Can Create
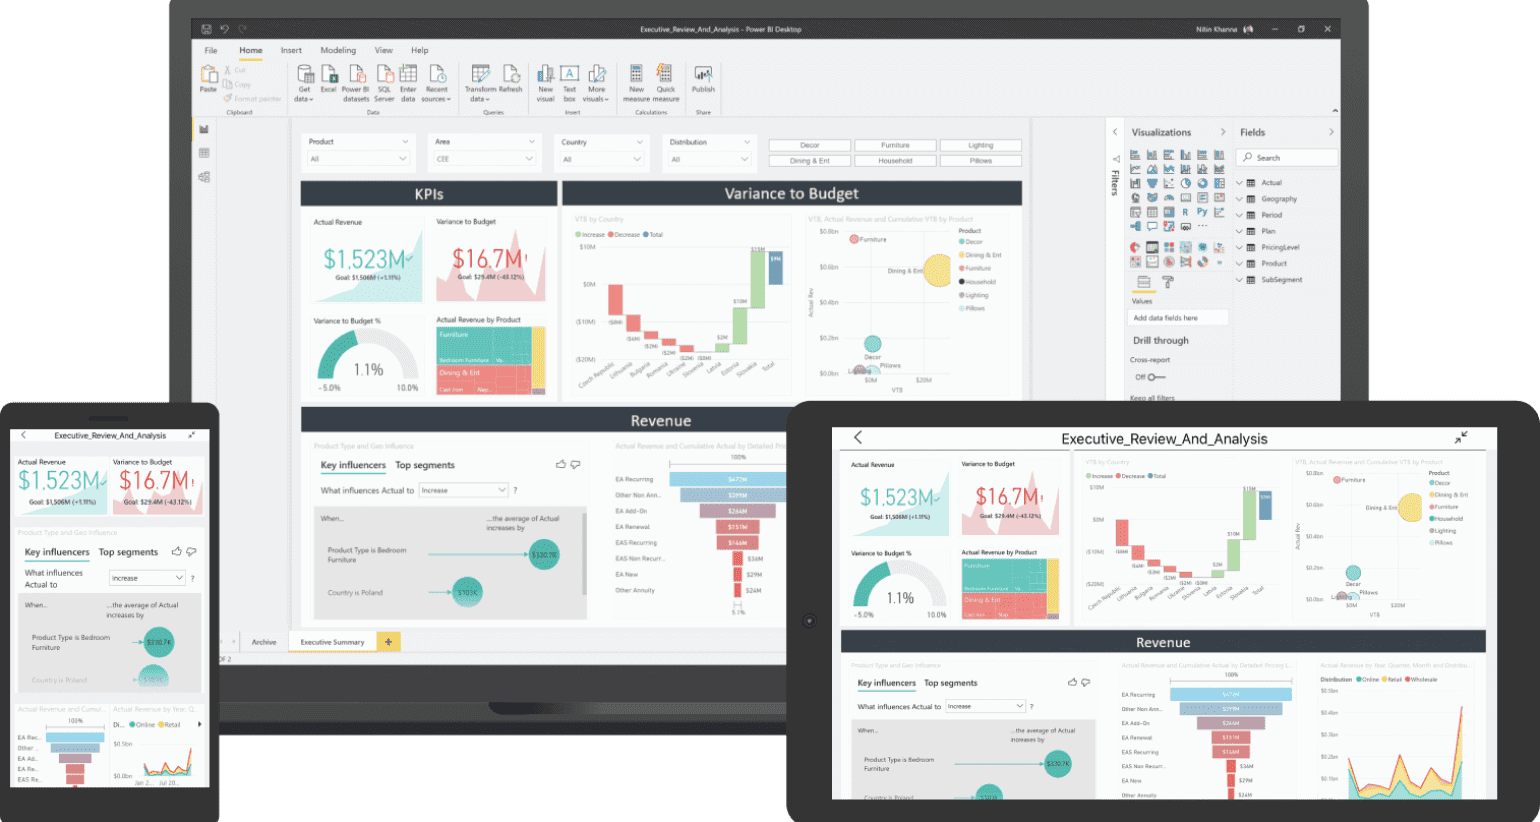
Image Courtesy of Microsoft
Benefits of Using Power BI as a Self-Service BI Tool
A self-service model requires both strong governance to ensure accuracy in reporting as well as flexibility so users can answer questions quickly. On top of all of this, there needs to be a way to distribute deliverables that still keeps that balance.
As we have worked on these projects, we’ve seen many ways in which Power BI meets these goals. In today’s post, I want to detail the different features in Power BI that helps uphold the goals listed above.
Access to Reliable Data
A true self-service BI tool must provide access to trusted, governed, and consistent data. Power BI’s semantic models serve as the foundation of this reliability. They define key measures, hierarchies, and business logic, ensuring that all reports, whether built by IT or business users, reflect the same definitions.
Through Microsoft Fabric, organizations can create default semantic models automatically when ingesting data, then customize or extend them to align with business needs. This approach helps reduce duplication and semantic drift across teams.
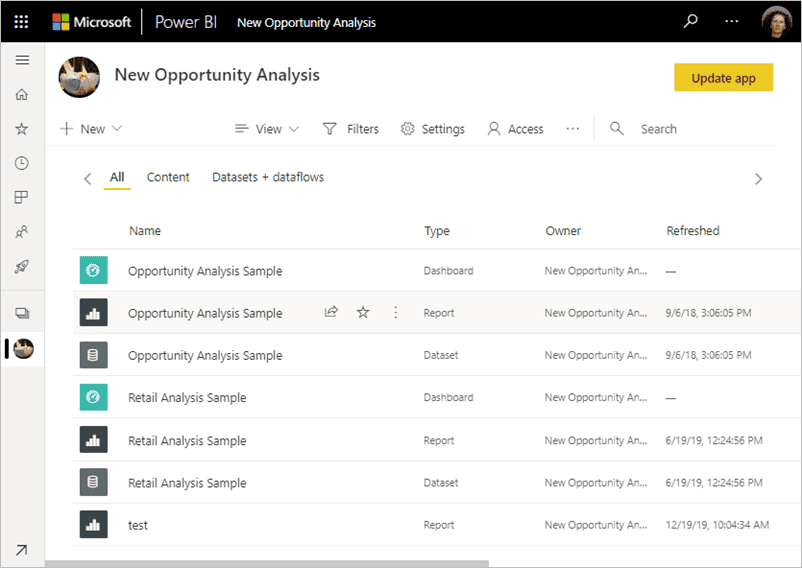
Image Courtesy of Microsoft
Empowering Business Users
Power BI’s intuitive interface and AI features make it simple for business users to explore data, build visualizations, and uncover insights without advanced technical knowledge.
With Copilot in Power BI, users can ask natural language questions, summarize dashboards, or generate reports automatically. This conversational interface, built on the semantic layer, helps teams focus on decisions rather than data wrangling.
Create and Save Deliverables Quickly for Your Own Purposes
Another key aspect of self-service analytics is giving users and analysts the ability to get answers to their questions quickly. Part of this is solved by providing users access to accurate data, but the other two parts of the equation are enabling users to build reports and helping them distribute those reports to disseminate insights to the rest of the team.
Power BI makes it easy to address both of those points. Regarding the first point, users can connect to published datasets and build their own reports with the data. They can also create new DAX calculations to customize the dataset to meet their own reporting needs
Once insights are developed, users can build and save dashboards, reports, and semantic models directly in the browser.
It’s important to understand that ad-hoc reporting can be a helpful way to quickly answer questions, but it may not meet certain reporting standards and can be hard for users to understand if they don’t have the context of the report. Because of this, it can be best to have dedicated workspaces for either reports that are still in “development” and don’t meet those standards or workspaces that function like sandboxes, for users to develop and experiment with new ideas.
Power BI now supports web modeling, version control via Git, and semantic model editing in Fabric workspaces. This allows analytics teams to collaborate seamlessly, track changes, and maintain alignment across development and production environments.
Users can also connect these models to other Fabric experiences, such as Data Science or Real-Time Intelligence, ensuring that every insight is built on a consistent foundation.
Distribute Deliverables
Finally, the last step of the process is to determine the best way to distribute deliverables that are ready to be consumed by end-users. As I alluded to in the point above, a lot of end-users will need reporting deliverables to be carefully curated for them to understand the content they are looking for.
Power BI makes sharing insights effortless through workspaces, apps, Teams integration, and embedding in internal portals.
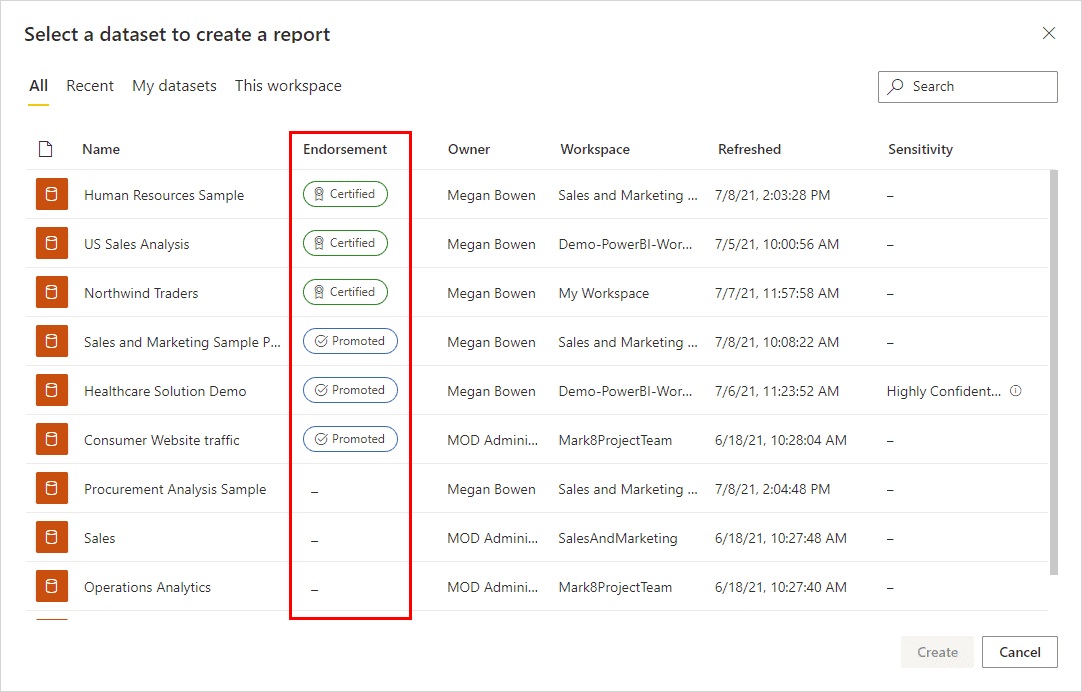
Admins can “certify” content, making it easy for users to visibly identify which reports and dashboards meet organizational reporting standards.
Another way in which content can be curated is through Workspace Apps. An app can be created for each workspace, which can be used to package and surface selected reports that exist in the workspace in one space. This can be a great way to direct users who aren’t as comfortable navigating Power BI to relevant content.
Notifications can be configured for users through subscriptions and alerts. This helps admins embed analytics into the daily process of end-users, and makes analytics more accessible as a whole.
In Fabric, semantic models are shared assets, not siloed datasets. Business units can collaborate on common models, ensuring everyone views the same KPIs and logic.
Additionally, Copilot for Power BI extends collaboration further by allowing users to explain visuals, summarize trends, or ask questions about report content, improving accessibility for all levels of data fluency.
Are you ready for self-service BI?
There is a significant shift towards self-service BI in recent years. The Power BI adoption process requires an in-depth understanding of the entire data management system. With the right framework, training, and governance, organizations can gradually move from a controlled BI approach to a managed self-service BI approach and achieve tremendous insights and, thus, success for their business.
Keep Reading: Power BI Governance
Looking for more on data & analytics?
Explore more insights and expertise at smartbridge.com/data
There’s more to explore at Smartbridge.com!
Sign up to be notified when we publish articles, news, videos and more!
Other ways to
follow us:


