JD Edwards Development & You
In this article, we’ll go over some tips and tricks to help you succeed with JD Edwards development.
Table of Contents
Watch the Tutorial Video!
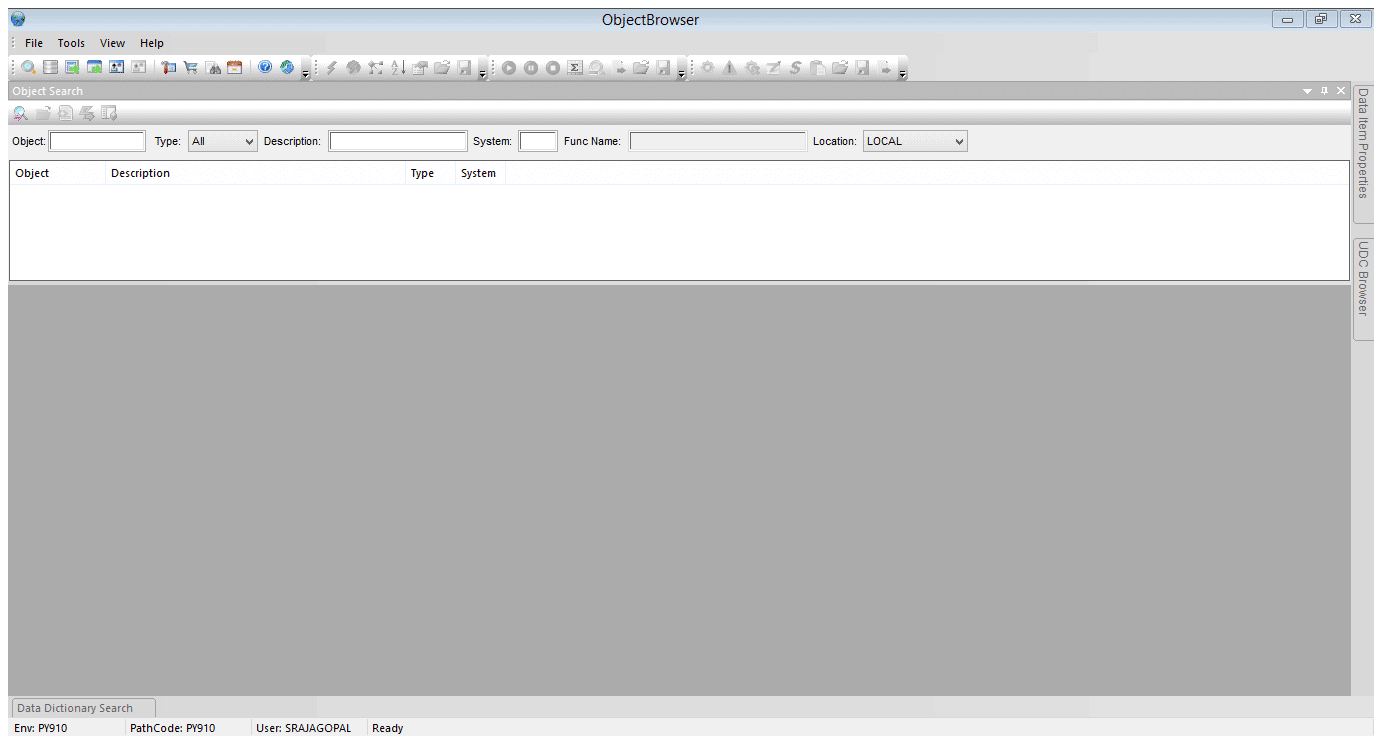
Object Browser
With recent releases of Oracle JD Edwards (JDE) EnterpriseOne, there has never been a better time to be a JDE Developer. While these advances are good (as they take advantage of newer technology, faster processing, and offer advanced hardware features), the structured process to begin development within JDE is still a drawback. Consider for a moment, that you’ve been presented with an issue to solve, or even more simply, you are trying to figure out what a specific report does.
Normally, once you login to JDE, you will need to create a project, assign a user and a role, find the object and then review. When you have to do this once or twice, the time it takes to set-up the object for review is negligible. But when you have to repeat the tasks for an endless lists of objects, its time to work smarter, not harder. This usually occurs during system upgrades, determining whether the custom objects are in regular use and what purpose, if any, do they serve? By using JDE Object Browser, you can save time and achieve results in a timely manner, without it becoming tedious.
To explain further, you will need to have EnterpriseOne installed, and be able to login via FAT Client. Here is the typical process for accessing objects within JDE:
- Login to JDE
- Create a project
- Assign an owner
- Search and add object to project
- Get / Check-out the object, for a recent version
- Design to open and see the details of the object
- Check-out / Erase check-out when done
While this process exists to ensure integrity, and establish a trail of breadcrumbs, when dealing with a lot of objects, it does not lend itself for easy and simple reviews of objects, such as;
- Report (UBE)
- Application (APPL)
- Table or Business View
My tool of choice for easy access to these object is JDE Object Browser. Its ease of use allows me to:
- Quickly access the objects from any environment
- Identify the different report sections and view the code
- Browse and filter the data in the views and columns
- Mitigate risk of accidently making any changes to the object
We can utilize JDE Object Browser to:
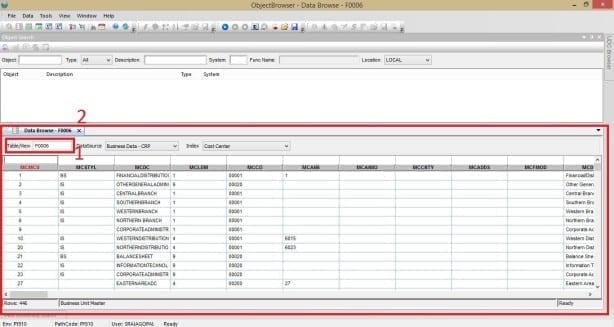
- Browse data in the tables
- View the objects within the Browser, in pre-formatted sections.
- Extract the objects into specific file formats (txt, csv, html)
And much more. In the following section, I’ll step you through how to access and use the JDE Object Browser.
Initial Login and Access
In order to use JDE Object Browser, you would have to initially login to JDE, and then launch Object Browser.
UBEs and APPLICATIONS
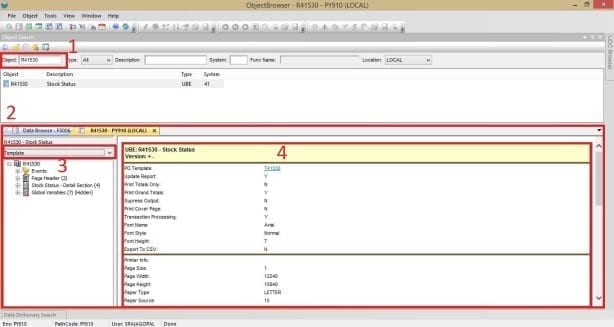
To quickly view Report objects, you can
- Specify the object name, – Ex: [R41530]
- Choose the data source, if blank it will default to [LOCAL]
Once you press Enter, a new tab will populate relaying the information as depicted in the image below.
- Object Name Specification – Double click object from list
- Tab Selection – Current active tab in yellow
- Dropdown – Choose between the template and the versions of the object
- Details of the current selection
BULK EXPORTS
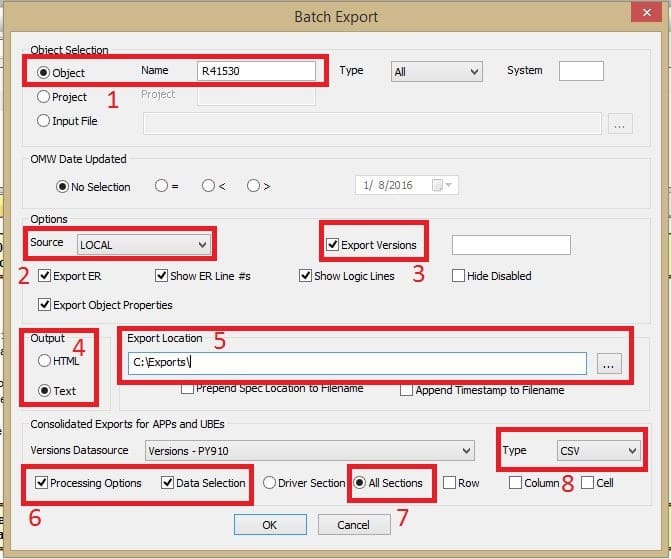
To extract a full object, and its versions, select Tools – Batch Export.
- Specify a report / UBE object – Ex: [R41530]
- Specify the environment – Source – [LOCAL]
- Enable ‘Export Versions’
- Select Output format – HTML or [Text] – I prefer text
- Select an export location – [C:Exports]
- Under Consolidated Exports for APPs and UBEs, Enable [Processing Options] and [Data Selections] for the versions
- Enable [All Sections]
- Select Type – [CSV]
Once the export is complete, you can access the export location to view the files in your favorite text editor, for quick find, compare, and verify.
To sum it all up, when you have to review lots of objects within your JDE Environment, adding it all to projects and going through it, one object at a time is not really the best use of your time. The easy accessibility of the objects, within JDE, through the Object Browser saves a lot of time.
Event Rules Debugger
It’s staggering to me that I always find something to overlook, especially when I’m scripting to solve some of the simplest problems. Routine, tedious, repetitive tasks are some of these problems that we all try to script for. Consider parsing through a list of servers or email addresses, perhaps a comma-delimited document, to achieve some purpose, such that you don’t have to do the task manually. For us developers, the issue isn’t writing the script, but rather the fact that we always tend to overlook something, something small, and something we already know.
The purpose of this article is to introduce JD Edwards Event Rules (ER) Debugger, because it is our best friend in figuring out the reason for some of the problems that we encounter. If we can master ER Debugger, then large, complicated, time-intensive problems will become that much easier to tackle, when we’re trying to overcome our learning curve and solve much larger problems.
The Problem
The script is used to read a list of contents from a file, to be parsed for easier viewing. When having to deal with a large list of objects, it really comes in handy. However, the report fails to list the objects correctly. Therefore, our objective is to, together, using the debugger, figure out the reason for the error and fix the script.
The focus of the article will be on JDE ER Debugger. For a more detailed view, a short video detailing the process can be viewed on our YouTube channel.
Using ER Debugger
Upon login to JDE, within Solution Explorer, navigate to the debugger by expanding the following menu items:
EnterpriseOne Life Cycle Tools -> Application Development -> Object Management -> Debug Application
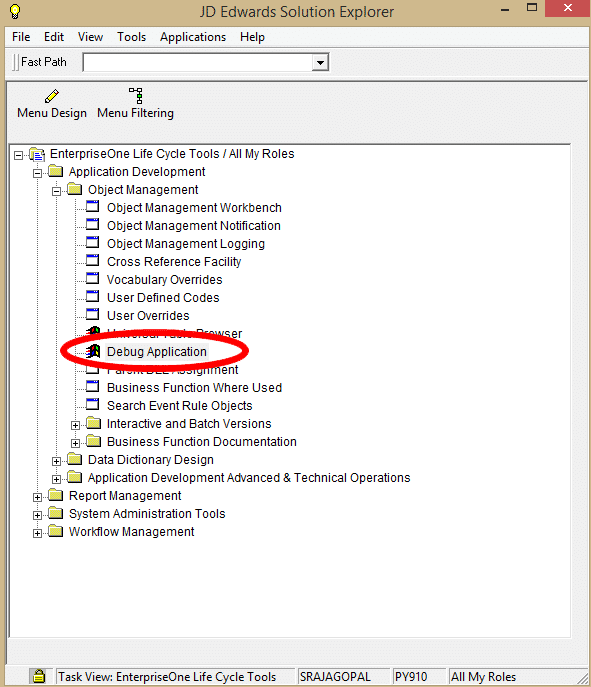
Essentially, there are five views to get comfortable with the ER Debugger. The five views help you setup the problem for testing. This process will remain the same for any application that you wish to debug. The views are:
- Object Browser
- Application
- Debug Window
- Breakpoints
- Variables
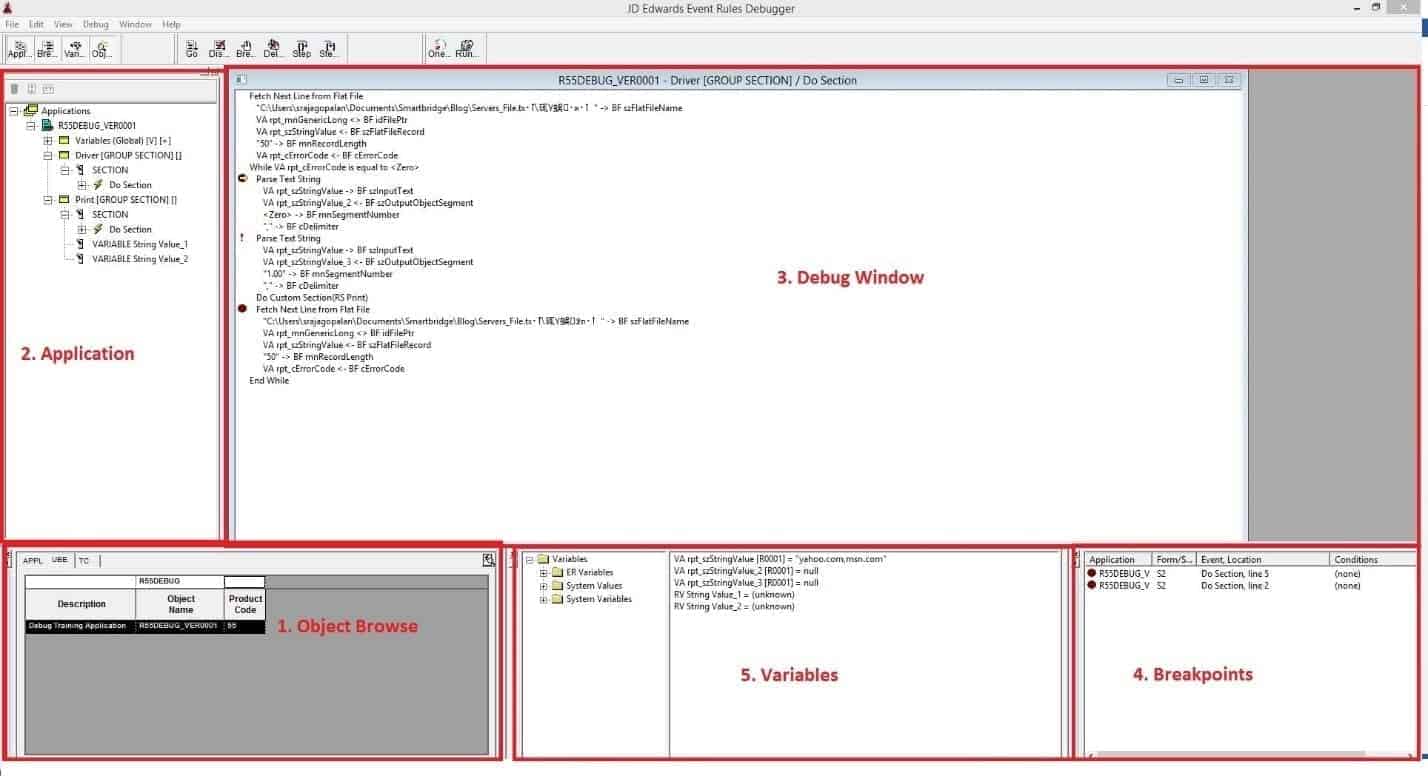
Step 1
Begin by browsing for the batch application within the Object Browser, and double click the version to add it to the Application View. For our example, it will be the version for “R55ADOBJ” – “R55DEBUG|VER0001”.
Step 2
You can then navigate through the batch application in the Application view, to identify the Event Rules in a specific section to debug. This will load the event rules within the debug window. For our example, it will be “Driver” Section, and double click “Do Section”.
Step 3
Within the debug window, we can double click on a specific line to insert a breakpoint. We can add as many breakpoints as needed within the code. A breakpoint will stop the execution of the script at the specific point or points you have marked, such that you can monitor the values of the variables that you have selected in the Variables view. For our example, we will add the breakpoint at two points:
- “Parse Text String” – First appearance “Fetch Next Line from Flat File” – Second appearance
Step 4
Furthermore, you will notice that the breakpoints you added will be displayed in the Breakpoints View for easy navigation.
Step 5
In the Variables View, expand ER Variables and select specific Variables to monitor. Furthermore, this also exposes all the system values and variables, if needed. For our example, we will:
- Expand “ER Variables”
- Add “VA rpt_szStringValue”
- Add “VA rpt_szStringValue_2”
- Add “VA rpt_szStringValue_3”
- In Applications View, Expand “Print” Section, Select “DO” Section
- In Variables View, Expand “Report Variables”
- Add “RV String Value_1”
- Add “RV String Value_2”
- In Variables View, Expand “Report Variables”
Test
Our batch application is now ready for testing. For the purposes of the brevity, I will not detail the steps to execute the application locally. But upon execution of the batch application, we will focus on the ER Debugger due to the breakpoints we have set, and the values of the variables will update. At this point, we have a few options.
Keyboard Shortcuts
- [F9] – We can execute one line at a time
- [F5] – We can execute the code until it reaches the next breakpoint
- [F10] – We can execute into a specific business function to fully understand what’s going on
To resolve our sample issue, we will execute until we reach the next breakpoint and the problem becomes clear.
Solution
Once the version is executed, we can then switch to the debugger to control the flow. The script will stop at the first breakpoint set. Press F5 once to execute again. It will stop at the next breakpoint and update the variable values. We can see that the string value is parsed, however the second value is not stored in the variable. Continue executing until the report executes and you’ll notice that only the first string value is reported, not the second.

The batch application will fully execute, and the highlighted value will not update. In our example, to resolve the issue, there are two steps we need to take.
The obvious fix is the assignment of second string value to the variable. The business function, “Parse Text String” only returns one value. Therefore, we will call it twice to return both string values from the text file. The following line will need to be enabled within the Event Rules. The line is currently commented, disabling execution, and therefore you may re-enable it.
[FIRST STEP]
Line 5: Parse Text String
Line 6: ! Parse Text String
Line 7: Do Custom Section(RS Print)
[SECOND STEP]
Line 1: RV String Value_1 = VA rpt_szStringValue_2
Line 2: RV String Value_2 = VA rpt_szStringValue_3
Upon another execution of the script, the report will display all the objects correctly.
For a detailed view of the execution and debugging of this report, please feel free to view the YouTube video. When troubleshooting scripts of our own creation, the knowledge of the variables and the types of data that is passed, is clear to us, the developers. Even with small issues, as posed by this sample, the use of the Debugger helps us immensely in becoming intimate with the purpose of the application.
Furthermore, both standard functions and custom functions may not work as intended. With the use of the debugger, we can shed some light into the functionality. In a production environment, providing support for standard and custom reports created by developers that came before you requires becoming intimate with the application. JDE ER Debugger quickly becomes an asset, helping understand, reveal and resolve problems both large and small. You may overlook the smallest of things, but JDE ER Debugger will help look over them.
Event Rules Compare
Software updates are released to address bugs, enable features and improve functionality. But how do you know exactly what updates were released? One way is to utilize Event Rules Compare.
JDE Enterprise One is setup with multiple environments, with some of them being:
PS – Pristine
DV – Development
PY – Prototype
PD – Production
This setup enables the use of a developmental life cycle to control what objects are released into production. Therefore, the objects in production are usually different when compared to the others. This is usually because a customized business process requires a change. Then, the standard objects (APPL, UBE etc.,) are then retrofitted to meet the business needs.
Furthermore, custom reports and applications are also developed based on standard reports provided by Oracle. In both cases, when you need to identify what changes have occurred, Event Rules Compare is a handy tool that can be used to note the differences between the objects.
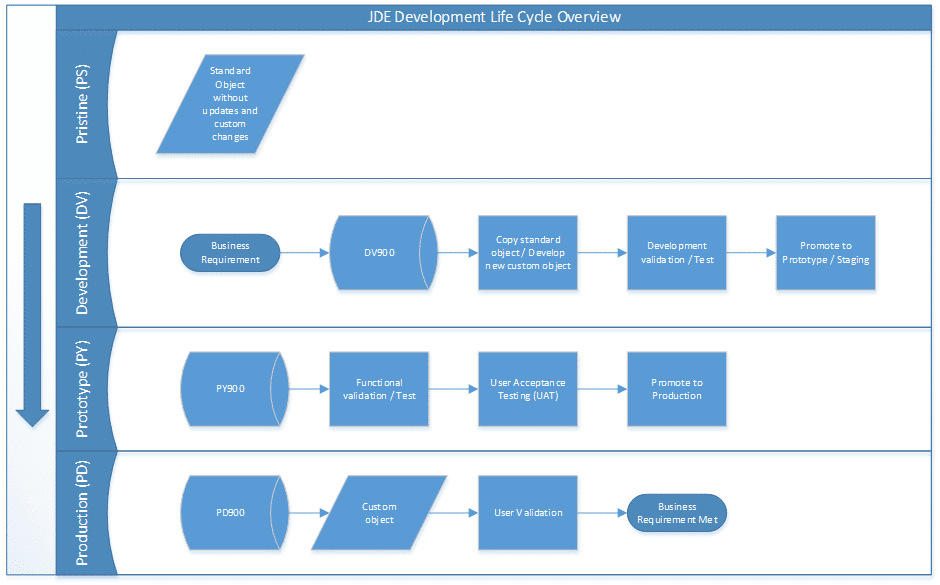
In this article, we’ll compare an object to introduce you to the subtleties of Event Rules Compare. Plus, we’ll help you focus on key items that can help make your job easier when comparing two objects.
You will need access to a JDE FAT Client, and an application (APPL) or a report (UBE) that you would like to compare. We’ll be using the application P01012, and we will be comparing Production against Pristine.
To access Event Rules Compare, Login to your FAT Client and access Object Management Workbench.
- Add and select the report – P01012, in your project
- Select “Row”, then “Advanced Get”, from “PD900”
- Then select the report “P01012”, and select “Design”
- Select “Design Tools”
- Select “ER Compare”
- Type the environment to which we will compare the object – “PS900”
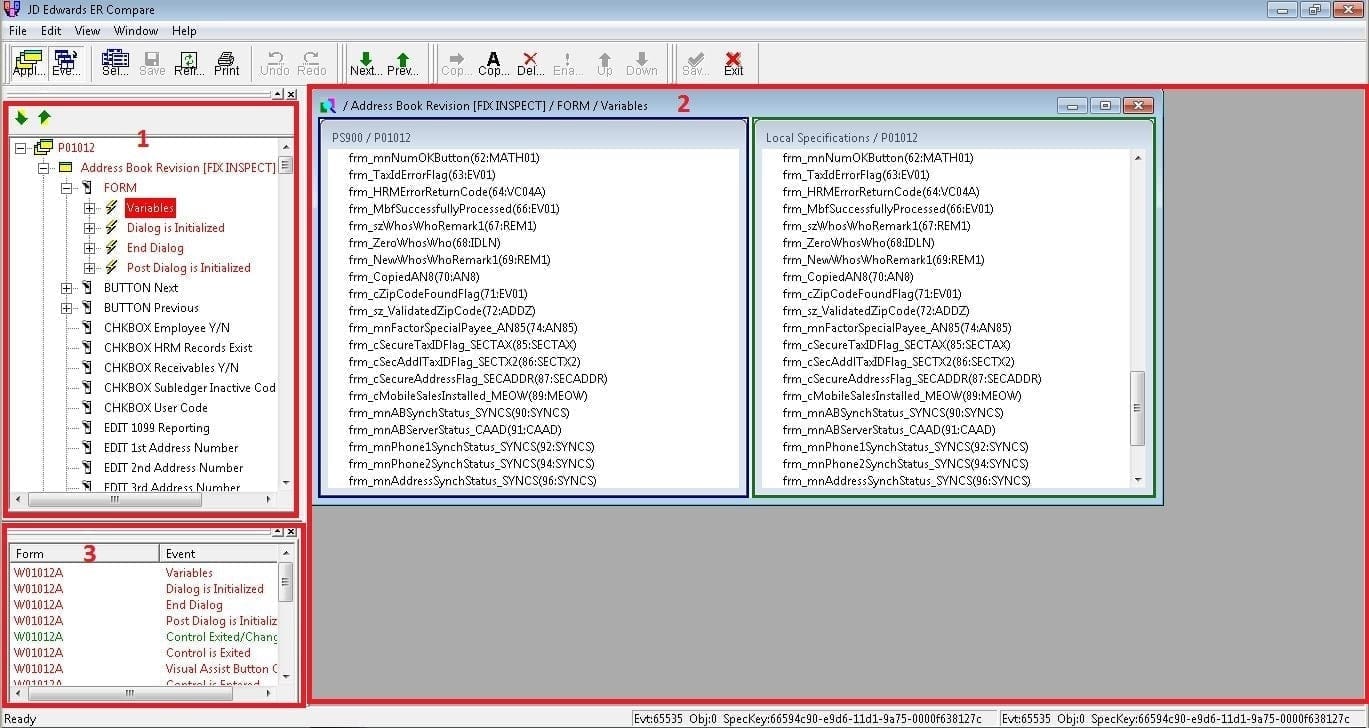
There are three views to get accustomed to upon initial loading of Event Rules Compare:
1 – Events with Differences
2 – Event rules window (Target
Within events with differences, you’ll notice marked in one of four colors:
RED – There’s a difference in Event Rules
GREEN – The difference exists only in your local specification
BLUE – The difference exists only in your target
BLACK – No difference
You can navigate through the difference, in one of many ways as well. You can:
This is helpful when troubleshooting applications and reports that have seen modification but contain no comments to mark the specific changes. Comparing the object in production to pristine will list all the differences, including any updates or bug fixes released by Oracle.
Furthermore, the updates released by Oracle are also marked as Software Action Request (SAR). Any code introduced into the object will be commented by Oracle, including a SAR number. Therefore, any code that is not commented is most likely a custom change that was introduced.
This ability provided by the application to identify the differences immensely helps, when changes are required or when a system upgrade is necessary. But the icing on the cake, has to be the merge functionality. But be warned, improper use of this functionality could result in undesired results, as you will have consider a few things before merging the code between two different objects. You can also selectively copy or remove single lines of code as needed. However, the changes should be reversed if copying the code invalidates the event rules. A few items to take into consideration are:
- Variables – Do they exist in both environments? Are there duplicates?
- IF ELSE – Verify the logic of all conditions
- WHILE ENDWHILE – Verify the logic of all conditions
Alternatively, I’d strongly suggest that you make note of the changes that exist, and alter them through Form or Report Design Aid, while continuously validating the event rules to verify the functionality of the report or application.
Event Rules Compare is a handy tool, and its applications are intuitive. From software updates, bug fixes to code changes and system upgrades, the tool has a very specific purpose to compare and help JDE developers perform. Not to mention, while the developmental life cycle requires this separation of objects in the different environments, it also helps with maintaining the integrity of a production system. Event Rules Compare is just another tool to help support that developmental life cycle, in continued maintenance and development of a production system.
There’s more to explore at Smartbridge.com!
Sign up to be notified when we publish articles, news, videos and more!
Other ways to
follow us:


