Highlights from the 2020 Tableau Conference-ish
Recently, Tableau put on an online conference full of educational sessions, speakers, and also unveiling what the future looks like for the software. In this article, we’ll go over some of the key takeaways from this year’s event.
Tableau just wrapped up their 3-day virtual event, Tableau Conference-ish which I got to attend and take part in several of the sessions this year. It was so inspiring hearing about the new things Tableau is working towards, so I want to provide some of the highlights of the conference.
The conference started off with a few keynote presentations from different speakers including Tableau CEO, Adam Selipsky. They highlighted the massive issues we’ve faced in 2020, and how people have been using Tableau to work through data to help solve these problems. They also provided a roadmap of what new features are coming to Tableau, including some big news about the merging of Salesforce’s Einstein Analytics with Tableau (we’ll cover this in another blog post soon).
After that, there were a wide variety of eye-opening sessions that covered several topics. Some were panels of business execs from different industries describing how data and Tableau fit into their work. Others were in-depth sessions with solution partners, such as Snowflake or Einstein Analytics, that detailed how Tableau integrates closely with their tools.
There were even great sessions about how to understand data and analysis in a broader sense, that were hosted by world-renowned astrophysicist, Neil deGrasse Tyson, and Nate Silver, founder of the famous predictive analytics website fivethirtyeight.com.

Image Courtesy of Tableau Conference-ish
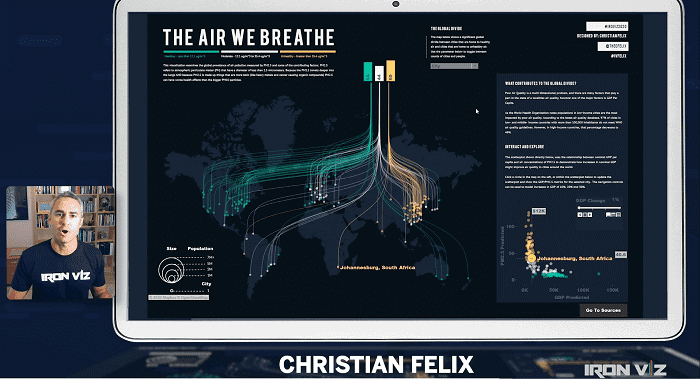
The Iron Viz competition was another exciting session. This is where 3 expert dashboard developers had 20 minutes to create the best dashboard they could based on the same dataset. It was a lot of fun to watch people who had an immense knowledge of the tool show off what’s possible.
Similar to that, some of the most engaging sessions were with the Tableau experts themselves, detailing the new features coming in future updates. There were several exciting features we’re looking forward to, but here are the ones we’re anticipating the most:
Tableau Advanced Analytics
Centralized Row Level Security
Row Level Security (RLS) will soon be able to be applied at the data source connection, making it easier for admins to ensure data can be accessed securely by the correct users in their dashboards.
Multi-Layered Map Visualizations
Map visuals can now contain multiple layers of icons allowing for developers to report on multiple topics on one map.
Improved Web Usage
Tableau provided many updates to the web client on Tableau Server including the following:
Improvements for Tools in the Tableau Suite
Lastly, one of my favorite parts of the conference was the testimonies from business execs about how Tableau is helping create strong data cultures. It has become incredibly clear this year with the COVID-19 crisis how important it is that we make decisions based on data, both on the large scale as a society as well as in our own organizations.
However, it takes more than just having good tools and useful data to create a culture that thinks analytically. It requires investment into teams to teach them how to use these tools and how to think analytically, as well as making sure teams have access to the right data to perform analysis. This isn’t always an easy task, but Tableau is working to make it easier by providing tools and resources for teams to train in these areas and share data with each other.
Overall, it was a phenomenal event that made me excited about all that Tableau is doing and reminded me of the massive impact data analysis has on our world!
Looking for more on data and analytics?
Explore more insights and expertise at Smartbridge.com/data
There’s more to explore at Smartbridge.com!
Sign up to be notified when we publish articles, news, videos and more!
Other ways to
follow us:


