

Power BI Best Practices
Have you deployed or are thinking about deploying Power BI in your organization? Before you dive in too deep, there are some best practices our experts recommend following to make sure your solution is scalable, secure, and built for the future.
Access to data for business users through self-service business intelligence (BI) has gained momentum in every industry. Digital transformation is a strategic priority for organizations of all sizes to stay nimble and competitive. Self-service business intelligence with Power BI (now a core experience with Microsoft Fabric) has democratized access to data for business users. Businesses no longer face a bottleneck waiting for IT to build reports. Instead, decision-makers can explore trusted insights on their own and take action quickly.
Alongside best practices, it helps to revisit foundational comparisons (such as Power BI advantages over Excel) to reinforce why many teams adopt Power BI for enterprise reporting.
Based on our experience helping organizations roll out Power BI and Fabric across departments, success depends on understanding how the technology framework integrates people, processes, and tools. Each component must work together to drive adoption and value across the enterprise.
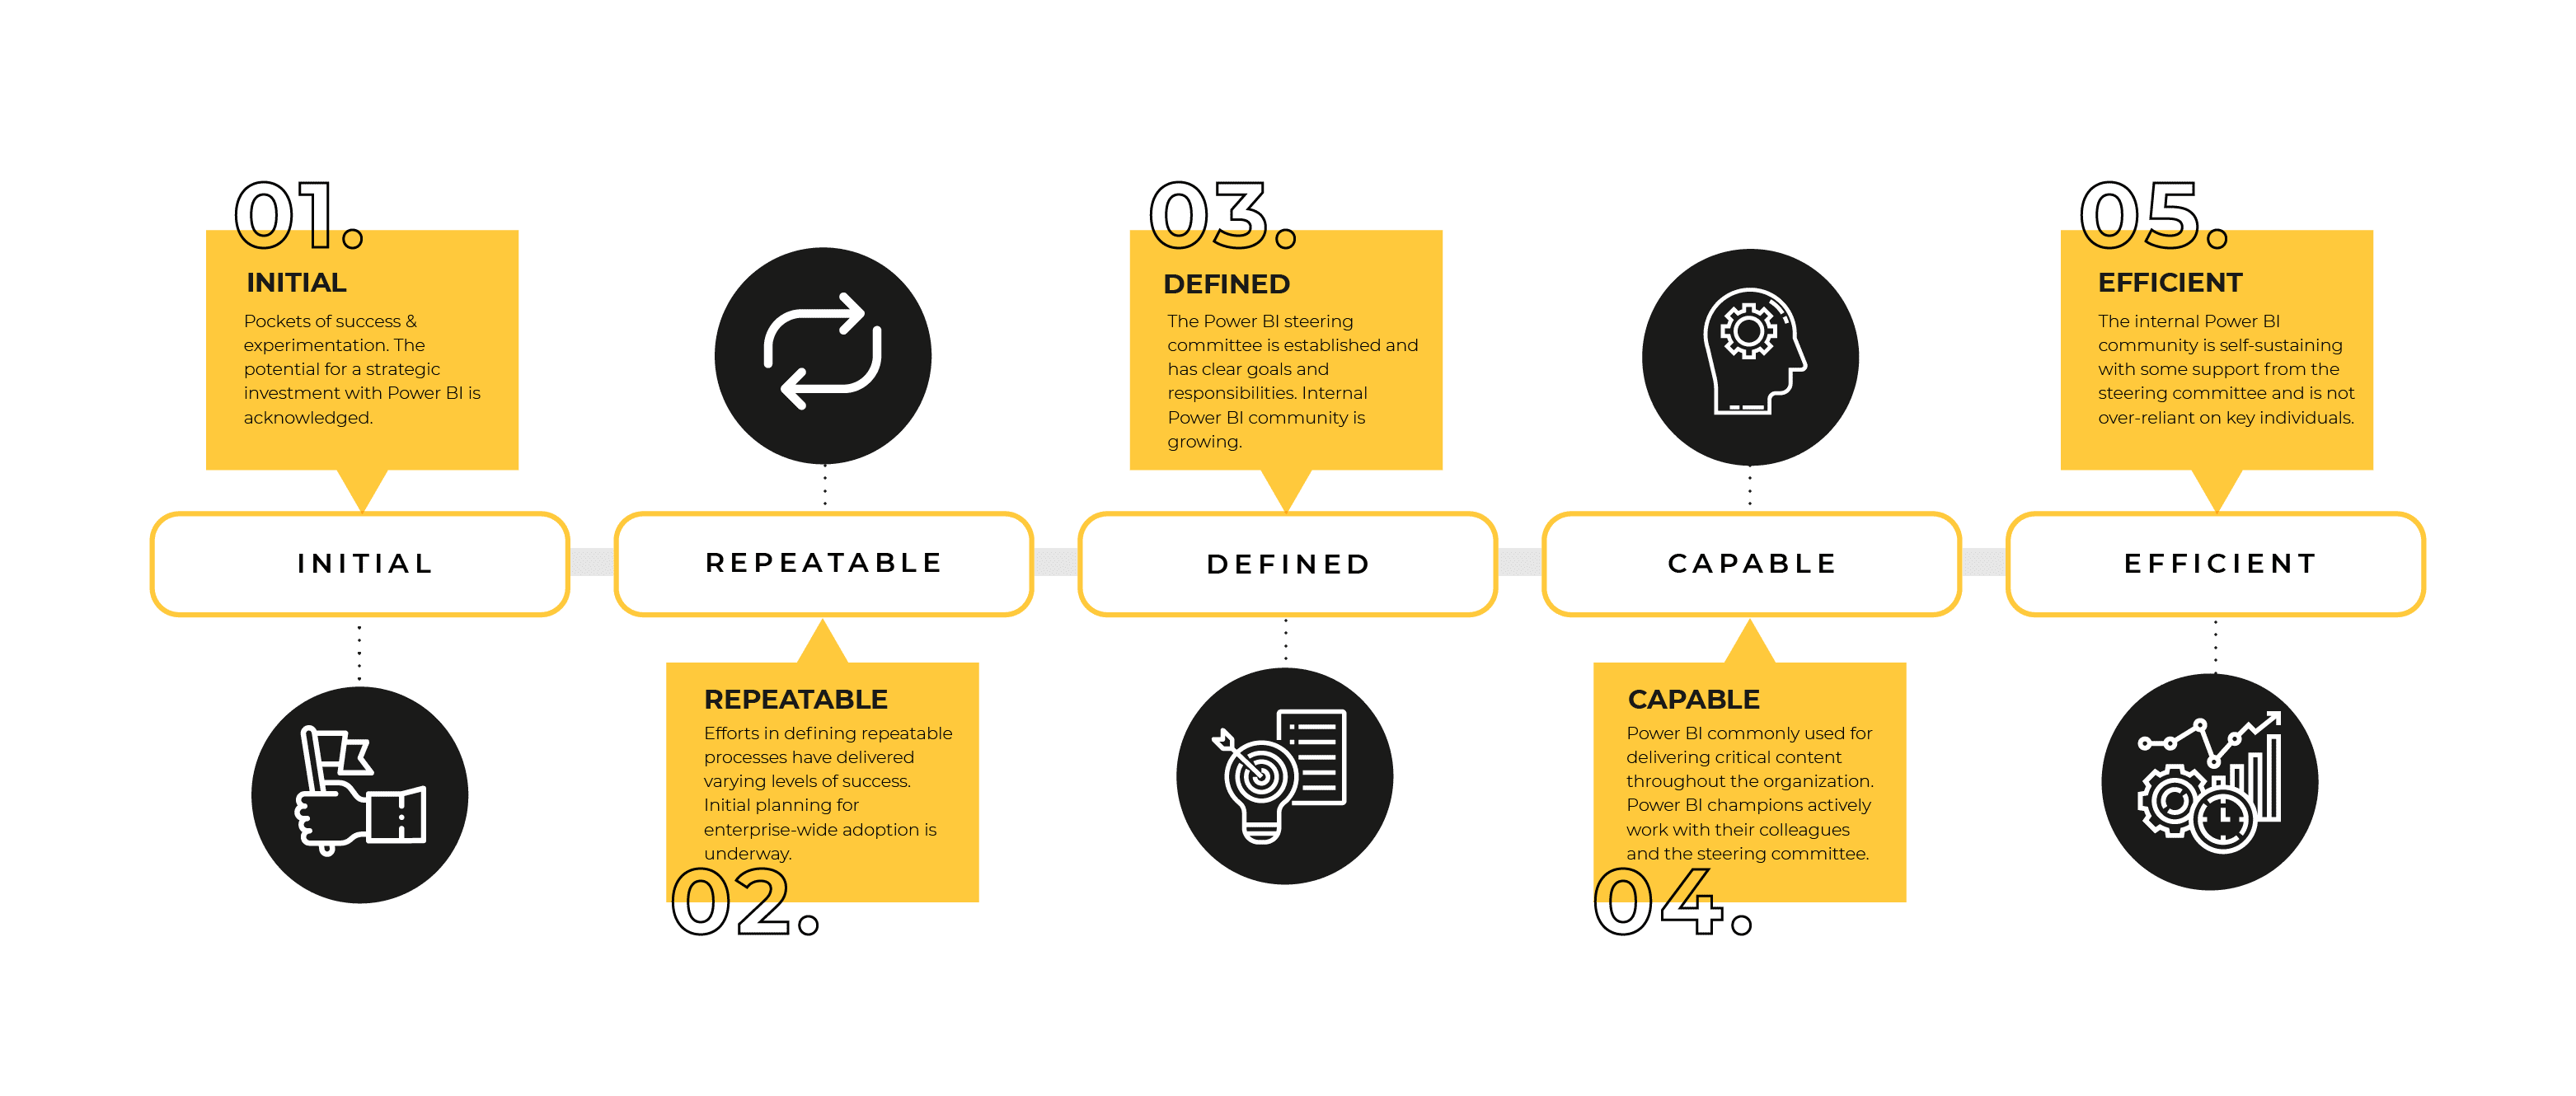
To foster personal, departmental, and enterprise BI skill maturity, there should be support and encouragement from leadership. To create a scalable self-service BI environment, a strong foundational core is needed. This foundation is built around people, processes, and technology.

People
Define the right roles, responsibilities, and levels of engagement for a steering committee to provide direction, mentorship, and support. Address and ensure you have each of these in place to effectively enable enterprise adoption, user engagement, and positive user experience:
Champions – The department champions are key advocates. They should promote enterprise BI and lead community-building efforts such as BI development projects or friendly competitions to encourage adoption.
Training – Have a variety of training formats available for users over the course of the adoption (external, internal, virtual, in-person, etc). Plan sessions regularly to build skills and confidence over time.
Standards – BI standards should be shared, clear, and regularly reviewed with users so they are as clear as possible on the content they are using. This includes data and visualization templates, naming conventions, and usage guidelines. To scale responsibly, pair these best practices with a clear Power BI governance approach that defines standards for workspaces, certified content, access, and ownership.
Knowledge – A user community will support increased knowledge sharing and adoption via channels such as:
Support – Multi-channel support helps users get quick answers without overwhelming IT. Examples include: champions, data owners, user groups, helpdesk, or direct Microsoft support.
As users advance their skills, knowledge, and understanding of Power BI and Fabric features, adoption and momentum naturally grow.
Click to enlarge
Process
Power BI’s integration within Microsoft Fabric has expanded what’s possible for self-service BI. Fabric unifies data movement, storage, and analytics in one platform, enabling better performance, easier collaboration, and a single source of truth.
To scale your self-service BI program, define the steps for implementing a certified data process across OneLake (Fabric’s unified data lake), Data Warehouses, and Power BI workspaces. Provide guidance on how quality data will be made available to end users and how certified content is shared.

There are a few questions you can ask yourself as you are building out your Power BI ecosystem such as:
Encourage local exploration, but require certified datasets for enterprise-wide sharing. Use Workspaces and Apps to make approved content easily accessible.
Best practices include:
By aligning processes with Fabric’s architecture, you’ll improve performance, reduce duplication, and maintain consistency across your BI environment.
Technology
Establish your Power BI and Fabric infrastructure early. Build a foundation that supports both flexibility and control as your organization grows.
Key steps:
With Fabric, Power BI users can now tap into a fully integrated data platform that brings data engineering, real-time analytics, and reporting together. This reduces complexity and allows business users to access the same trusted data that data engineers and analysts use.
Data Visualization
Keep dashboards simple, consistent, and user-friendly. Clear design standards will improve understanding and drive adoption.
A well-structured dashboard provides the steering committee and data owners with visibility into usage trends—such as most viewed content and peak usage times—and identifies reports that may need retiring.

Creating a data dictionary or glossary within Power BI will ensure consistency across your enterprise. Users can quickly find key data definitions and calculations as needed, improving trust and reducing confusion.

BONUS – Communication
A regular communication plan and cadence is a good practice to keep your Power BI user community up to speed and engaged.
Share updates on:
Consistent communication fosters engagement, improves adoption, and celebrates wins.
Adopting self-service BI with Power BI is a long-term journey with significant ROI. Success depends on a clear strategy, strong leadership, and ongoing education.
Understanding how Power BI and Fabric components work together is essential. The adoption process involves change management and a shift in mindset. Following best practices and supporting employees as they build new skills will help your organization create a trusted, scalable, and data-driven culture.