
Microsoft Fabric Real Time Analytics
In a recent Smartbridge Hackathon, a team explored using Microsoft Fabric to create a real time streaming analytics solution.
To stay ahead of the curve and cultivate a culture of innovation, Smartbridge conducts in-house hackathons throughout the year to test new technologies or case studies that could be beneficial to solving current client problems or to build up our consultants’ tool kits.
This past event consisted of a project that focused on the consumption of streaming data while transforming it and making it usable for a visualization tool to produce stunning graphics. Earlier this year, Microsoft rolled out their end-to-end analytics solution called Microsoft Fabric (note: some of their services are still in preview), and in the spirit of venturing into the unknown, the team at Smartbridge created a proof-of-concept solution using Microsoft Fabric to solve the streaming data analytics challenge.
Objective: Real Time Analytics using Fabric and Streaming Data
The need to stream data and having the ability to consume data in near real-time is an ever-growing requirement for competitive business industries as data becomes more and more available to companies than ever before. Gone are the days when it was deemed reasonable to take hours to massage data and get it to a stage where a visualization tool can consume it and create reports or visuals off of it.
Luckily, Microsoft is at the forefront of this need and their response to unifying the traditional Extract-Transform-Load process is Microsoft Fabric. The main objective for this exercise is to explore the functionality and usability of Microsoft’s newest offering along with utilizing some of the preview features such as setting up reflexes in Data Activator to add value to the solution.
In theory, we should be able to simulate a streaming dataset modeled after an IoT use case using an Azure event streams, then stage the data in an Azure Lakehouse, transform it in an SQL endpoint, and have a Power BI report consume it.
Challenges from Fabric, Power BI and other Real Time Analytics Difficulties
To give some background, event streams in Azure can bring high-frequency data into the SQL endpoint of the Lakehouse from four main sources: Sample Data, Event Hubs, IoT Hubs, or a Custom App. We created an event stream object using the “Stock Market” sample dataset to explore its enhanced UI/UX capabilities to stream data to a Lakehouse. Some of the key challenges we ran into while completing this solution were the following:
The Smartbridge Solution
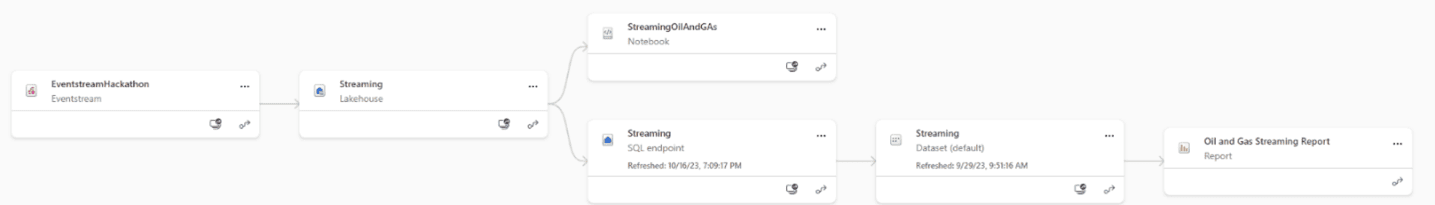
Fabric Enhanced Workspace UI/UX makes it way easier to keep track of lineage in its architecture.
With our objective in mind, we went to work on creating the simulated data following what would be our mock-up oil pipeline pressure readings. We created a script that fed CSV files with these made-up readings in a staggered 5-second interval to ensure continuous data was being fed into the solution. Then, we created an Azure Lakehouse to store the data that was captured from these CSVs. Next, the Lakehouse was connected to an Azure SQL endpoint.
The only transformations we did at this stage were appending the data from the different CSVs into one table. Once the data was established and running as expected, we created a Power BI report that connects directly to this SQL endpoint in Direct Query mode to get the latest data every time the report was interacted with along with troubleshooting the automatic refresh on the visuals.
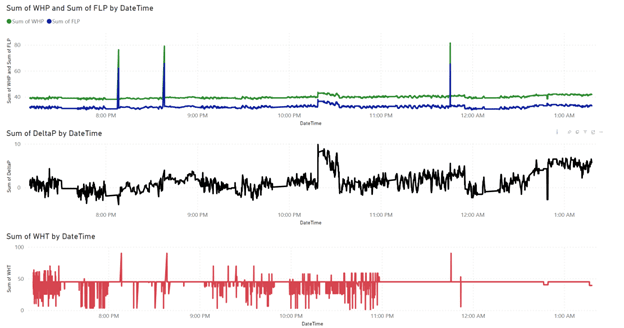
Final Output: A Power BI report with updates at a user-defined frequency and user-defined event triggers
The Results: Real Time Data!
By taking advantage of Microsoft Fabric, the team was able to create an end-to-end workflow solution from ingesting raw data, all the way to visualizing information and even creating email alerts for when said information has an anomaly.
The ETL process is not new, and we have had the capability of extracting data, transforming it, and loading it for some years now, but what Microsoft Fabric did differently is that it is all found in one centralized location.
The ability to view a single lineage from start to end is of high value, especially when needing to troubleshoot why a certain section of the pipeline is not behaving as expected.

Smartbridge is a Microsoft Fabric Featured Partner. Check out what that means!
Keep Reading: What is Microsoft Fabric?
Looking for more on data and analytics?
Explore more insights and expertise at smartbridge.com/data
There’s more to explore at Smartbridge.com!
Sign up to be notified when we publish articles, news, videos and more!
Other ways to
follow us: