
Measuring RPA Success Through UiPath Insights
Once an organization implements robotic process automation, how can its success be measured? We’ll explain how UiPath Insights can provide an analytical outlook to key performance indicators through their interactive dashboards.
Article originally published July 2020
UiPath Insights is an easy-to-use tool for both business stakeholders and RPA developers to analytically measure the success of automation. Insights are embedded into Orchestrator, require no separate installation, and store the data in a seperate SQL database. Note that the Insights for tenants function needs to be enabled from the Insights admin tool.

What is Important to Measure?
UiPath Insights has two types of metrics to measure operational and business-related KPIs:
Operational: Related to the execution of RPA implementation. These metrics focus more-so on the technical and development side of the implementation itself, and are likely more useful to the developers, analysts and other technical leads.
Business-Related: Aimed to grow and scale RPA in the organization. These metrics focus on the high-level outcome of the implementation, and are likely more appealing to the C-level/leadership members in your RPA Center of Excellence (CoE) team.
Built-In Dashboards
The interactive dashboards provided in UiPath Insights do more than just visualize the success rate of RPA. They also serve to set the business on track for hyperautomation initiatives by providing a thorough breakdown of the process itself, how it’s performing, and how it can be enhanced. There are four different types of built-in dashboards available in UiPath Insights that address the operational and business perspectives of the RPA success rate:
Robots: Robot dashboards track bot utilization, productivity, and errors. Robot dashboards also track the total hours worked per day for attended and unattended bots. For an attended bot, it scales between 0 to 8, and 8 to 24 hours. This dashboard is especially useful to provide a high-level performance overview to non-technical team members.
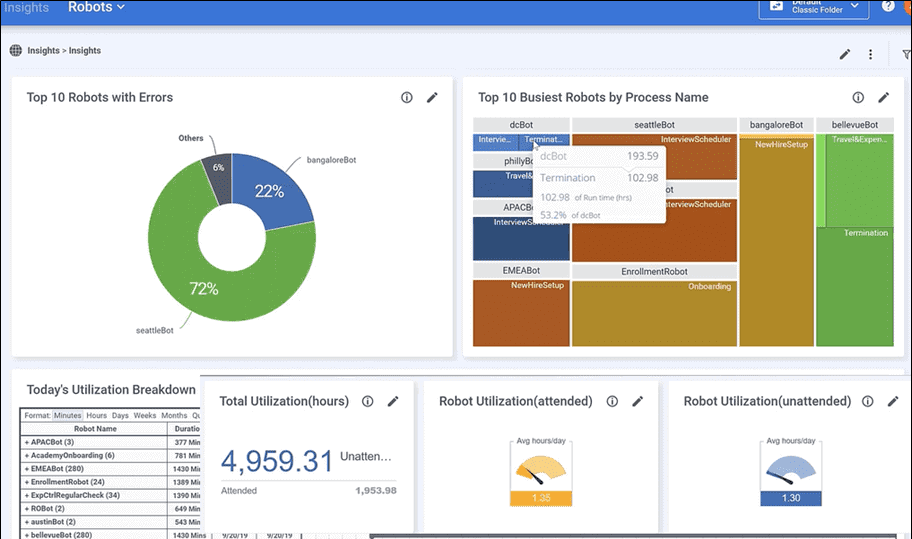
Image from: UiPath Academy
Processes Dashboard: The Processes dashboard provides highlights on metrics such as the run time of your processes, their success rate, as well as details on the errors encountered. It also gives you a breakdown of the top 10 processes currently being impacted by your RPA integration.
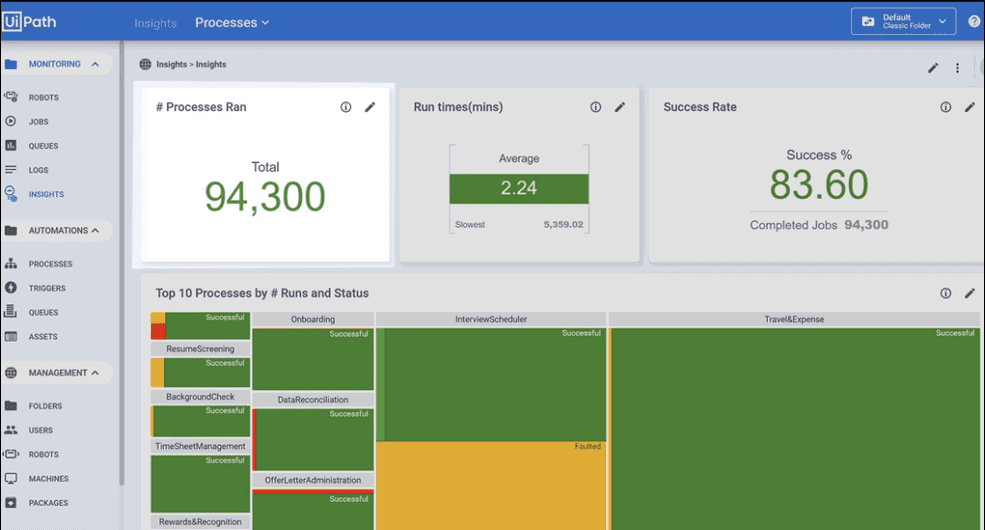
Image from: UiPath Academy
Queues: The Queues dashboard focuses on the most valuable insights related to your successful and failed transactions. It also breaks down the exceptions affecting these transactions, the specific transaction dates, and the average duration.
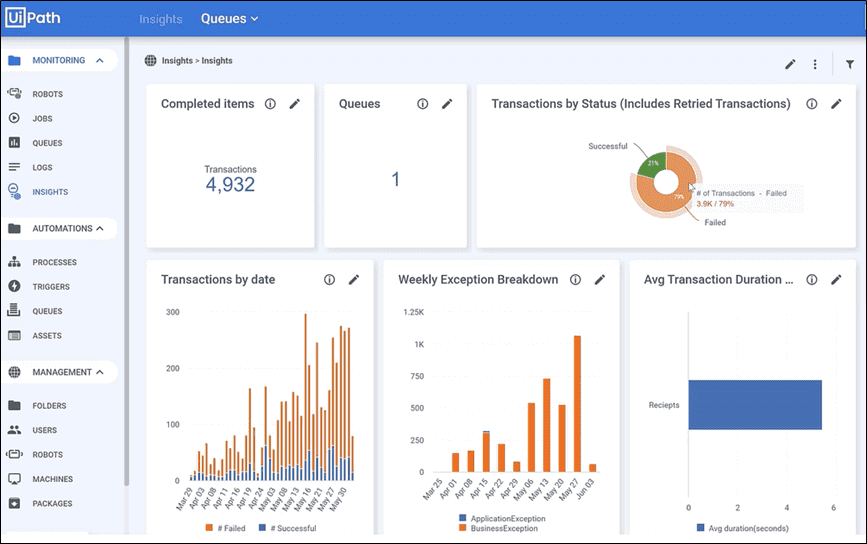
Image from: UiPath Academy
Business ROI: The Business ROI dashboard goes beyond operational data and provides insights into the actual impact generated by your robotic workforce within the business. It achieves this by tracking the money and time saved by your automation deployment. The “money saved per process” section, breaks down these financial impacts in more detail, and by category.
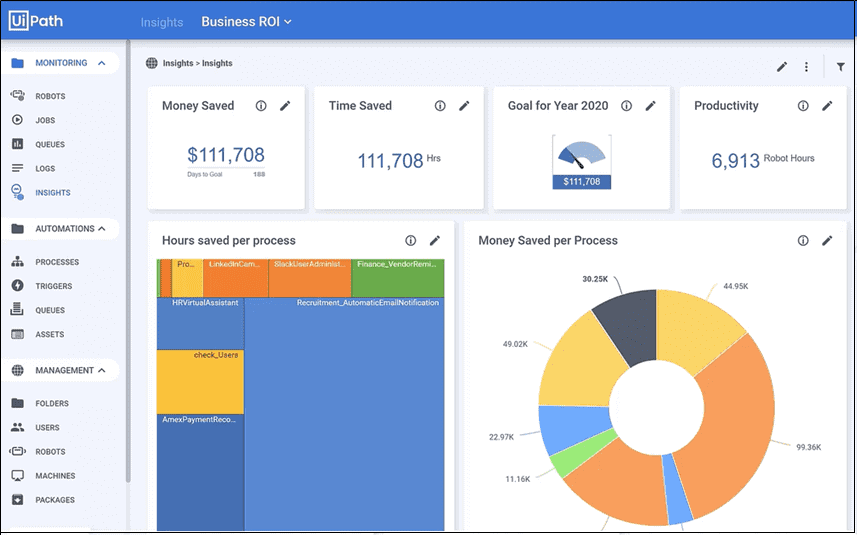
Image from: UiPath Academy
UiPath Insights is a Must for Success Measurement
The UiPath Insights tool is a crucial component to measuring the business and operational successes of RPA within an organization. By easily tracing and visualizing the return of investment through analytical dashboards, the Insights tool serves to keep developers, analysts and leadership on the same page throughout the automation journey.
Looking for more on RPA?
Explore more insights and expertise at smartbridge.com/automation
There’s more to explore at Smartbridge.com!
Sign up to be notified when we publish articles, news, videos and more!
Other ways to
follow us: