Enterprise Risk Management Powered By AI
Smartbridge can simplify and answer complex business questions when it comes to assessing and managing areas of enterprise risk by utilizing AI.
Value realization using data and analytics is becoming more common throughout companies across all industries today. An insight-driven approach led by artificial intelligence (AI) and machine learning (ML) can help address more complex questions, especially when it comes to risk management.
Let’s take, for example, an AI proof-of-concept we recently put together to assist a client in mitigating their enterprise risk by monitoring the health of their stores.
For this client, a leading QSR company, the business risk for a particular restaurant can change quickly. Therefore, their leadership team wanted the ability to have timely identification of these at-risk restaurants, so they can take the necessary actions to address these issues. In this case, business risk is measured through a combination of factors including revenue, customer churn, and brand reputation based on the current state and future state of the company.
Methodology
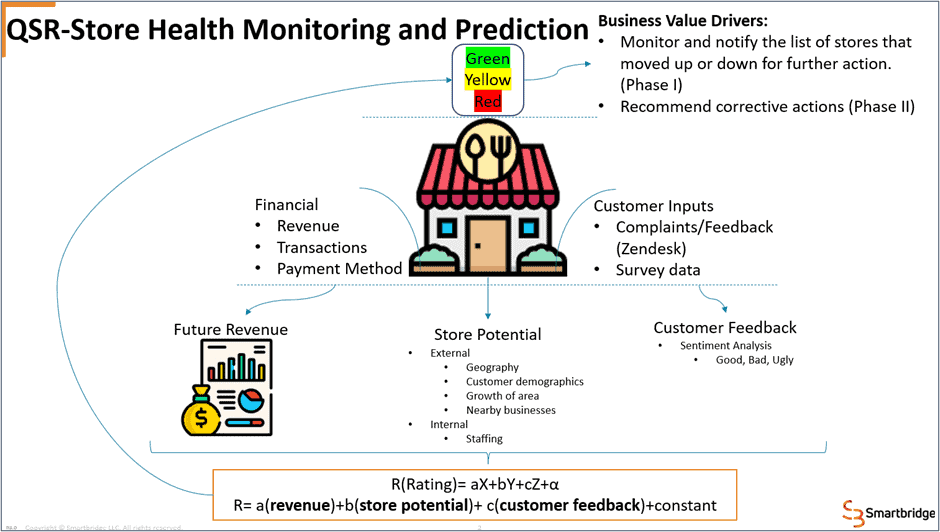
In order to create a solution, we needed to see what data was accessible to us. Some of the data sets were available at the enterprise level and some had to be derived by applying data science methods. The table below shows the available data and the attributes derived using data science methods.
| Data Set | Available Data | Developed Using Data Science |
|---|---|---|
| Financial | POS transaction details (revenue, time stamps, payment methods) | Short-term revenue projections (< 90 days), and long-term (> 90 days) revenue predictions |
| Store Potential | External: Geography, customer demographics, growth of area, and nearby businesses Internal: Staffing | Single economic indicator for the future potential of store (Future work) |
| Customer Inputs | Customer ratings complaints/feedback, survey data (QR code on receipts) | Customer Sentiment Analysis using NLP (Natural Language Processing) categorized into Good, Bad, and Ugly. |

Figure 1 – Store Health Indicator: Comprehensive Approach
Each of the attributes above(revenue, store potential, and customer feedback) are normalized on a scale of 1 to 5. These attributes were then synthesized into a store health (R) equation, described below.
R (Store Health) = a(revenue)+b(store potential)+ c(customer feedback)+constant
The normalized data and the equation can be modified as needed by the business. For instance, if the store health needs to be measured and centered around the customer, a simplistic way would be to allocate higher weights for customer ratings, customer reviews, and long-term revenue trend (see Figure 2). This approach is executed in a more sophisticated and complex way, and is dependent on the firm’s AI maturity.
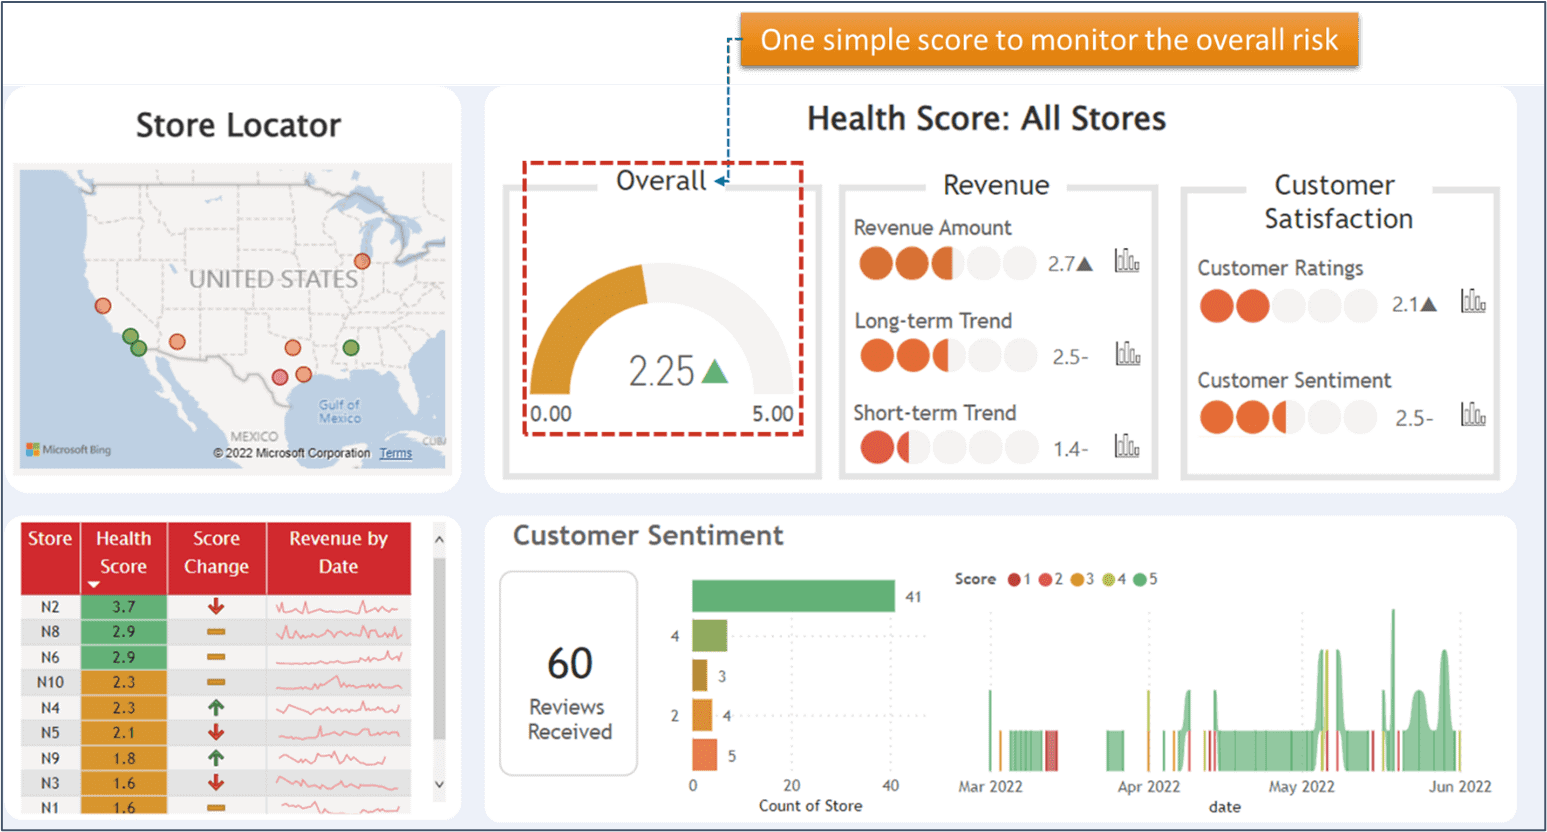
Once we receive our AI-calculated data, we’re able to display actionable insights on a dashboard like the one in Figure 3.
This solution can be implemented using a suite of Microsoft tools such as Azure Synapse and Azure ML for the backend and Power BI for the frontend.


Figure 2 – Store Health Indicator: Variations based on enterprise focus
(The one on the left represents an equal distribution of all variables, and the one on right represents higher weightage on long-term revenue and customer inputs.)

Figure 3 – Store Health Indicator Dashboard
(Left-hand side bottom indicates the list of stores, health scores, score change, and revenue by date. Right-hand side bottom plot is a common area used to visualize various attributes such as customer sentiment, revenue trends, etc.)
Results
Here are some highlights from a customer value perspective:
No matter what industry your organization is in, value realization and risk management through AI-led, insight-driven approaches can make a tremendous difference in the way your company operates. Let Smartbridge help. Our AI/ML experts are here to help you identify opportunities for digital innovation.
Looking for more on AI/ML?
Explore more insights and expertise at smartbridge.com/ai
There’s more to explore at Smartbridge.com!
Sign up to be notified when we publish articles, news, videos and more!
Other ways to
follow us:


