Power BI Mobile: Expand Your Business Intelligence Capabilities
These days, we expect everything to be mobile accessible including our business intelligence and analytics dashboards. Luckily for Power BI users, that isn’t a problem with Microsoft’s Power BI Mobile app.
Mobile technology plays a major role in everyone’s life. It is very difficult to imagine a day without having a phone or tablet in hand. Especially in today’s world with our unforeseen circumstances, it has played an important role in keeping people connected. The portability and usability of mobile technology is so high, in fact, that now most companies start developing their products based on mobile accessibility.
One such technology innovation from Microsoft is the Power BI mobile integration. The integration allows users to monitor their analytics wherever they are and keep track of Key Performance Indicators (KPIs) and reports. With Power BI Mobile Apps, you can get a 360-degree view of all your data, which can be secured in mobile apps with the help of Microsoft Intune.
The value created by mobile business intelligence applications in the workplace is growing as employees and management rely on mobile devices more than ever to access information and make decisions. Most users do not want to spend all day long staring at a computer monitor or may not have access to a desktop, so they demand quick, mobile access to information.
If you are considering a mobile strategy for your Power BI reports, this article will help you get started. These Power BI tips will give you an overview of the different ways that you can use mobile reporting. These tips are from industry experts, who have used their experience to help other users create more value with mobile reporting.
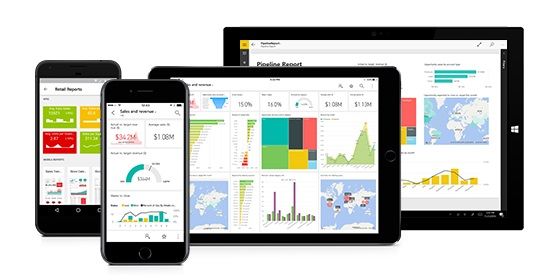
Image courtesy of Microsoft
Build a Mobile-Friendly Data Warehouse
The first step in creating a mobile strategy for your Power BI reports is to build a mobile-friendly data warehouse. This is a database that will hold all the information you need to report on. You want to ensure this database is designed to be mobile-friendly, so your users can easily navigate and build reports on-the-go.
If your database is not mobile-friendly, your users will have a much harder time navigating and reporting on data while they are on the move. This will, in turn, reduce the value that they can create with your data.
Mobile-friendly does not mean you must change your database drastically. Instead, you just need to make a few tweaks to make the information easier to navigate on small screens. You can do this by making your database tables smaller, creating data cubes, and simplifying your report visuals.
Create a Lite Version of Your Reports
One of the most common ways to use mobile reporting with Power BI is to create a lite version of your reports. A lite version of a report is simply a slim-down version of your usual report. Rather than hosting the full report on your app, you will host a lite version of the report.
This lite version will only include the most important data from your full report. When you create these types of reports you need to make sure that your data visualizations are simple and not overwhelming. It is always best practice to remove unnecessary visualizations from your report as it makes your report presentable and easy to navigate.
New Power BI Mobile Formatting Options
When you use the new mobile formatting options to create a mobile-optimized report, your visual interaction settings will be applied both in the mobile layout and on your mobile phone when you view the report.
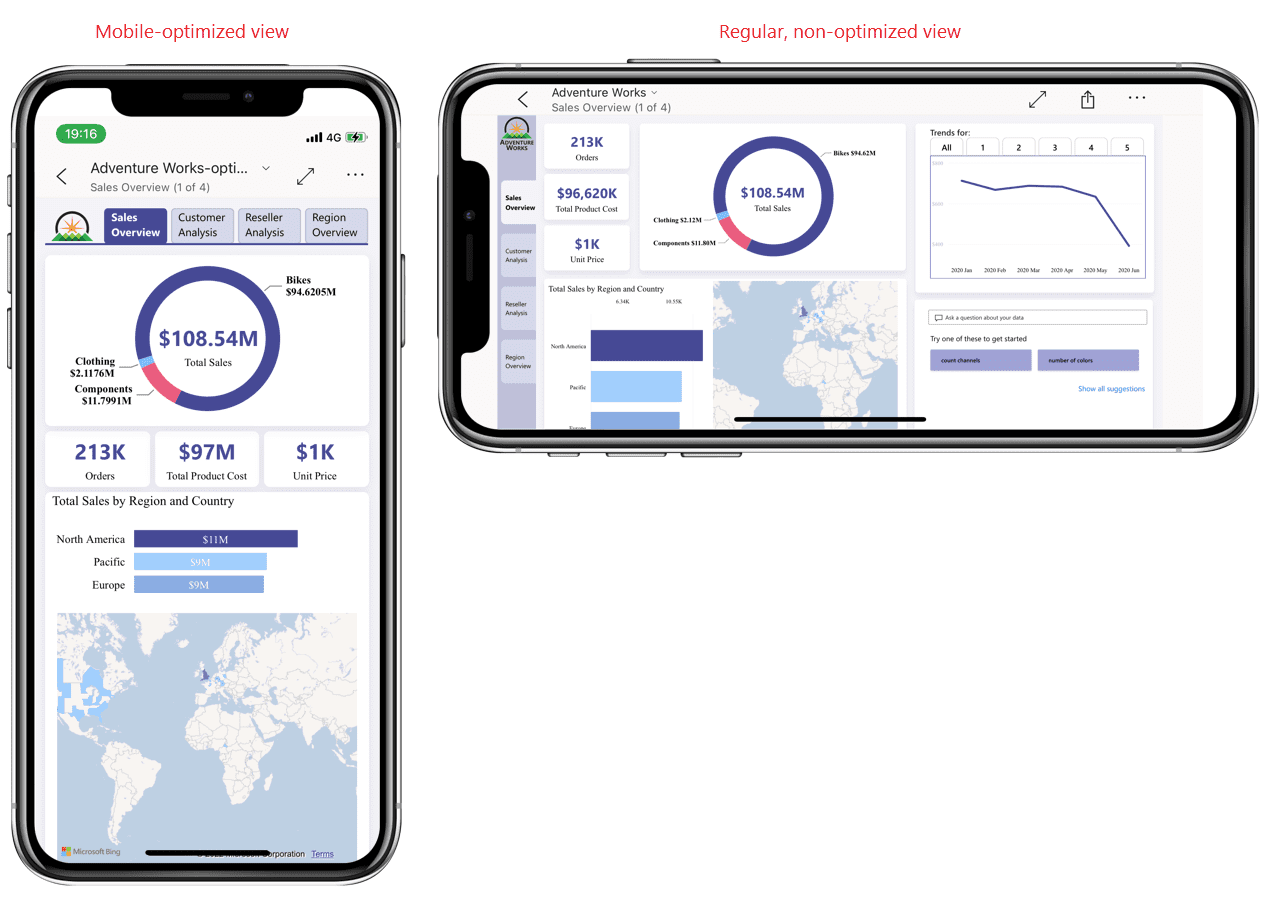
Image courtesy of Microsoft
Create Interactive Dashboards with Power BI Mobile
Another common way to use mobile reporting with Power BI is to create interactive dashboards. An interactive dashboard is a form of data visualization that allows your users to interact with the visualizations. When creating these interactive dashboards make sure your visuals are as simple as possible, so they are quick to load and easy to use. This will allow your users to quickly navigate to the information that they need.
A recent update in Power BI allows the users to also customize reports and tile visualization colors. You can use the same customizations in your mobile apps as well.
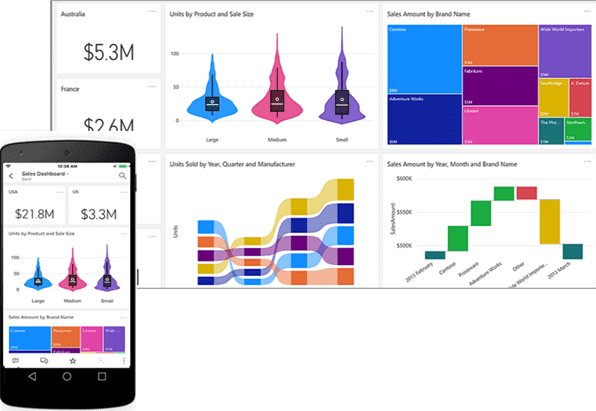
Image courtesy of Microsoft
Leverage Native Reporting Tools
A report is a static visual representation of data that does not interact with your data as a dashboard would. You can build a report then publish that report to your app. You can also build a report and host that report on Power BI. This will allow your report to be hosted on the Power BI platform and to be mobile-friendly.
The Power BI mobile apps allow users to access any Power BI report page. In some cases, reading and interacting with reports on mobile devices would be difficult. In order to overcome this issue, users can enable extra mobile-optimized views. When a page has a mobile-optimized view, it appears automatically when the mobile device is held in portrait mode. If the user wishes to see the non-optimized version of the page as it appears on their computer, they can tilt the phone to the side.
Enable Real-Time Data Exploration
Another common way to use mobile reporting with Power BI is to enable real-time data exploration. Real-time data exploration is a feature of Power BI that allows your users to interact with your data in real-time. When you enable real-time data exploration, your users will be able to explore different aspects of your data and interact with report visuals in real-time. This will allow your users to quickly navigate to the information they need and to make instant decisions based on that data.
Provide On-the-Go Collaboration Tools
Power BI provides on-the-go collaboration tools, which allows your users to quickly share information and insights with one another. This will let your users quickly communicate insights and quotes with one another, which will, in turn, allow them to create more value with your data.
In April 2022, Microsoft added a new feature called Interaction to the Mobile app settings. This feature has different options:
There were also 2 new push notifications introduced in the April 2022 Power BI release:
These are just a few ways that you can use mobile reporting with Power BI to create value. To recap, if you want to use mobile reporting, you want to ensure that your data is also mobile-friendly. You can do this by slimming down your database tables and keeping your data visualizations and dimensions simple.
Power BI is playing a major role in getting business insights and predicting future ones for a lot of companies. It is an incredible and powerful tool, especially for the everyday business user. If you’re looking to adopt Power BI for your organization or have already deployed it but want to know some best practices, Smartbridge has you covered. Download our Power BI Adoption Framework to help you get started.
Looking for more on Data & Analytics?
Explore more insights and expertise at smartbridge.com/data
Keep Reading: Power BI – An Optimal Self-Service BI Tool
There’s more to explore at Smartbridge.com!
Sign up to be notified when we publish articles, news, videos and more!
Other ways to
follow us:


