Transitioning from Grid Reports to Dashboards & Mobile
The Client
Largest US operator of bagel bakeries, with over 795 company owned, franchised, and licensed locations.
The Problem
This multi-concept restaurant operator was experiencing the “spreadmart” phenomenon, with its accounting department manually creating and distributing grid-based excel reports to operations so they can manage their stores.
The client wanted to create a single version of the truth for enterprise reporting, consolidate multiple reporting tools, and eliminate these massive and manually generated spreadsheets. In addition, they wanted to move from grid-based reports to visual analytics, and enable executives and field leadership with mobile access to critical information and performance dashboards.
The Solution
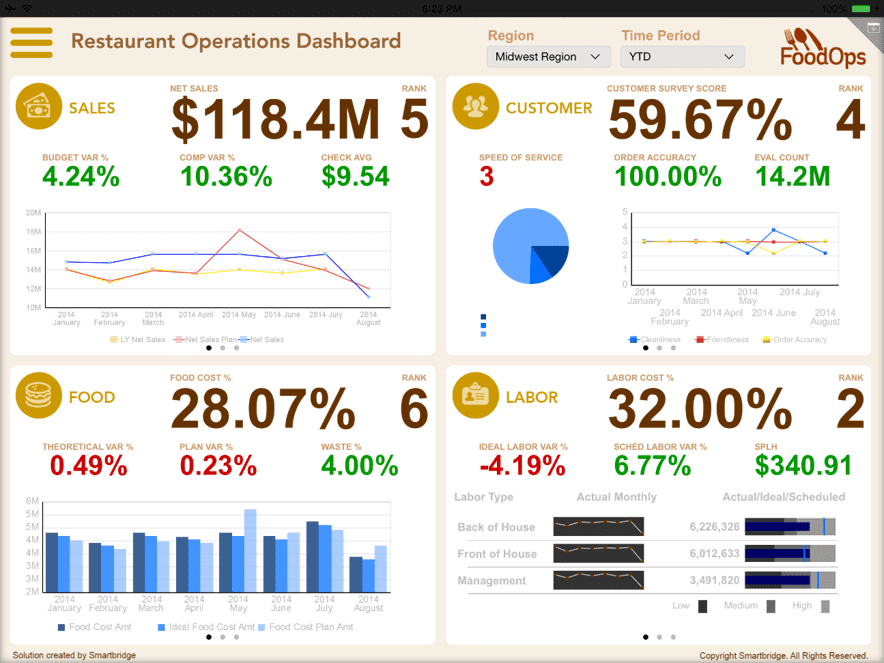
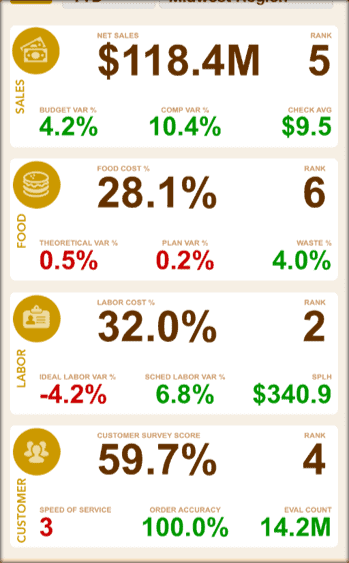
Leveraging FoodOps BI solution accelerator, Smartbridge team designed, developed, integrated and launched Mobile dashboards for the executive team, finance, and regional operations executives. The project was executed following an agile BI approach to deliver continuous value to the business in a rapid manner.
FoodOps is a standardized food industry analytics solution accelerator built based on decades of industry expertise in QSR, fast casual and full service segments. It comes with pre-defined data models, KPIs, dashboards and micro apps to digitally enable typical food field operations.
The key activities:

Example of a dashboard built in FoodOps (tablet view)

Example of a dashboard built in FoodOps (phone view)
The Result
The features allocated to the 3 sprints (store information, geographical store performance, and period-level financial reporting) were delivered successfully, and we completed the project on-time and under budget. Multiple touch-points with end users during sprint execution yielded an extremely relevant solution, and the solution was successfully deployed to the pilot users.
Overall feedback from field users and executives was extremely positive, and created an increase in the demand for new features and enhancements (which have been added to the backlog). The results achieved in the initial phase led to strategic executive decisions to enhance the company’s BI capabilities and transform the company to an information-driven decision making organization.
There’s more to explore at Smartbridge.com!
Sign up to be notified when we publish articles, news, videos and more!
Other ways to
follow us:


