Intro to Advanced Analytics

The world of business intelligence is evolving, moving away from traditional BI to advanced analytics. We’ll go over what advanced analytics is, why you need it, and how it can be used.

Article originally published March 2022

What technological changes have led to the change in analytics?

In traditional business intelligence (BI), the purpose of reporting was greatly limited to the functionality offered by available tools. This means that reports were generally static (not interactive) and were distributed on a schedule (didn’t come with live updates). The tools were also limited in how much data they could process, so data typically had to be cleaned and aggregated. This meant that reports typically were focused on descriptive analytics, which focuses on describing trends and performance of historical performance.

Nowadays, with the improvement of technology, BI reporting has more options available and is moving more towards analysis-oriented BI. Organizations want to get a 360-degree view of their customers in a timely manner, identify the root causes of success or failure in business operations, and control as much future uncertainty as possible. These demands can’t be satisfied with traditional BI dashboards and reports and can’t be supported by a traditional BI architecture.

New technologies have improved analytics and helped organizations begin to address these complex problems. Data lakes capture large volumes of data, both structured and unstructured, and provide users access to data they never could get to before. Artificial Intelligence and Machine Learning (AI/ML) tools are available for advanced and novice analysts to build predictive models to develop even better insights. Streaming integrations can be implemented to get live data in user dashboards so employees can make decisions in real-time.

Power BI partner
Databricks

Smartbridge Has Expertise in Advanced Analytics Technologies

How is the approach different from advanced analytics?

With the advent of new tools that can handle large amounts of data and apply new analytical techniques, there becomes a fundamental difference between traditional and advanced approaches to analytics. Since there are more limitations with traditional BI, reports are designed to address a limited number of questions and requirements. On top of this, they are not flexible enough to easily adapt to new features. This is fine when the process is simple and repeated, but it’s more difficult when new questions arise.

Advanced analytics is focused on answering questions as they arise. New questions come up all the time, and businesses can’t always wait long periods of time for a newly repeated process to be built; they need answers now! There are numerous ways to approach this. By giving access to granular data, by providing self-service tools for machine learning, and by enabling tools that can ingest various types of data from various sources.

How to apply advanced analytics

There are various advanced analytics techniques that can be integrated into your existing BI architecture, and they’ll largely depend on your organization’s use cases. I want to briefly touch on some of those techniques, as well as some relevant use cases for those techniques.

Real-Time Analytics

As already discussed, teams are looking to make decisions based on the latest data, and sometimes, that involves having live updates from various systems. Because of tools such as Azure Stream Analytics, Azure Event Hubs, and other streaming tools, organizations can integrate live data into dashboards and other analytics deliverables for users to consume.

Learn about how Smartbridge has implemented streaming analytics >>

Typical Analytics QuestionPotential Analytics Outcome
Risk Analysis

How can we detect payment fraud?

Detect indicators of fraud and decline a payment once it is predicted as a fraud:

  • Avoid revenue loss from fraudulent orders
  • Save labor costs from time-consuming validations and costly chargebacks
Marketing

What are the most effective product recommendations we can provide shoppers on our website?

Streaming data can help make live adjustments to customers’ recommendations

  • Improve sales and suggestions through better recommendations
  • Increase customer loyalty by providing better suggestions

Utilizing Unstructured Data

The proliferation of big data means that data now comes in all shapes and sizes. Where traditional BI relied heavily on tabular and structured data, teams now need to gather insights from semi structured and unstructured data, such as email messages, social media posts, or video and image files. Big data storage solutions like Azure Data Lake are making it easier to collect this kind of data so that data scientists can perform analysis on them in tools like Databricks and Azure Synapse Analytics. Here are some examples of this:

Typical Analytics QuestionPotential Analytics Outcome
HR

What trends can be discovered from employee surveys?

Capitalize on employee feedback using text-based analysis:

  • Identify prevailing trends in surveys quicker
  • Continue to reduce turnover by acting on employee requests
Marketing

How can we monitor the reputation of our organization?

Analyze related social comments and news in real-time, react immediately towards events with the potential to negatively affect reputation:

  • Mitigate negative influence on brand equity and business operations
  • Rapidly identify and resolve customer satisfaction issues, potentially turning a negative customer situation into a loyalty-building opportunity

Predictive Forecasting

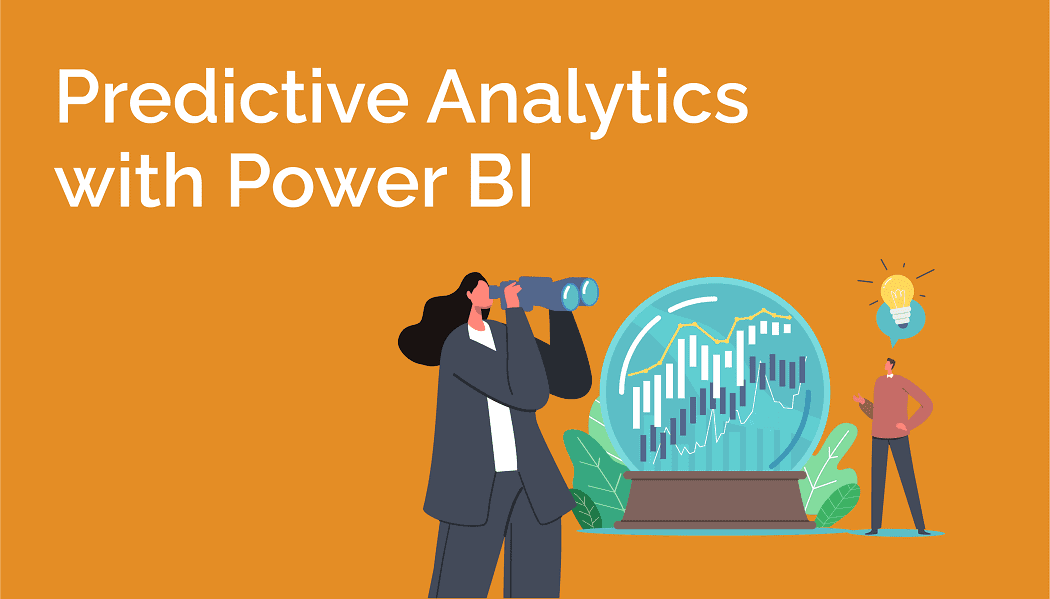
Another big advantage of advanced analytics is being able to use statistical models to perform more accurate forecasting. Traditional BI leveraged simple trends from historical data and tribal knowledge within organizations to create forecasts. However, with tools like Databricks, Azure AutoML, and Azure Synapse, users can develop much more robust and accurate forecasts based on the relevant data inputs. Some beneficial examples of this are as follow:

Typical Analytics QuestionPotential Analytics Outcome
HR

How can we identify which employees are most likely to leave?

Predict the probability to leave and take proactive actions to remove potential reasons for attrition:

  • Reduce the probability of unexpected turnover
  • Reduce talent acquisition and training costs
Operations

How might unscheduled events change forecasting for production?
Allow for individual store locations to adjust predictions for the day based on the local events occurring around them:

  • Recalibrate projections for the day based on changes in available labor and materials
  • Limit waste when nearby events will reduce or increase customer traffic

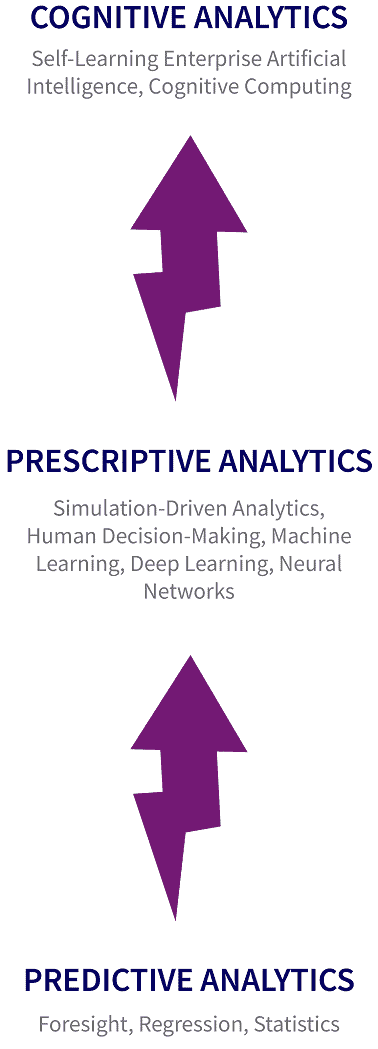
Prescriptive Analytics

Most organizations are striving to make data-informed decisions. With traditional BI reporting, this can be a difficult task as it requires employees to interpret historical data and then try to determine the correct decisions. However, advanced analytics techniques help simplify decision-making by deciphering trends and categories within historical data. These can be used to help create prescriptive instructions for users to follow and help them make better decisions on the job. Here are some examples:

Typical Analytics QuestionPotential Analytics Outcome
Operations

What is the best resource allocation strategy?

Simulate and optimize resource allocations:

  • Maximize profit per unit of resource invested
  • Ensure efficient satisfaction of market demand
Marketing

What synergistic items should be bundled and promoted together to drive incremental sales?
Bundle products intelligently and scientifically design cross-sell promotions:

  • Increase margin/sales volume gained from cross-sales/up-sales
  • More accurately drive product procurement and manufacturing forecasts

Share This:

Looking for more on Data & Analytics?

Explore more insights and expertise at Smartbridge.com/data

There’s more to explore at Smartbridge.com!

Sign up to be notified when we publish articles, news, videos and more!