Power BI vs Tableau: Which Business Intelligence Tool is Right for You?
Deciding between two major business intelligence(BI) tools like Microsoft Power BI and Tableau can be a tough choice if you’re unsure of their differences and applications. One of our data analytics consultants breaks down the most important details you need to know to find the best BI tool that works for you.
In recent studies, over half of the surveyed executives didn’t believe they have the right technology to implement a digital transformation. One of the most important pieces of this digital transformation puzzle is choosing the right business intelligence tool and integrating it with an organization’s existing stack of tools and technology available.
As a business leader, finding the right business intelligence tool and empowering your business users with it can help you pave the road to growth and success. This article explores the two most popular business tools available in the market today: Power BI and Tableau. The idea is not to state which tool is better amongst the two, but to help you understand which tool will better suit your business requirements.
One Size Doesn’t Fit All
Since there are plenty of options available in the market these days, choosing the right tool and technology can be challenging for companies. Answering the following questions can help you decide which tool suits your business requirements:
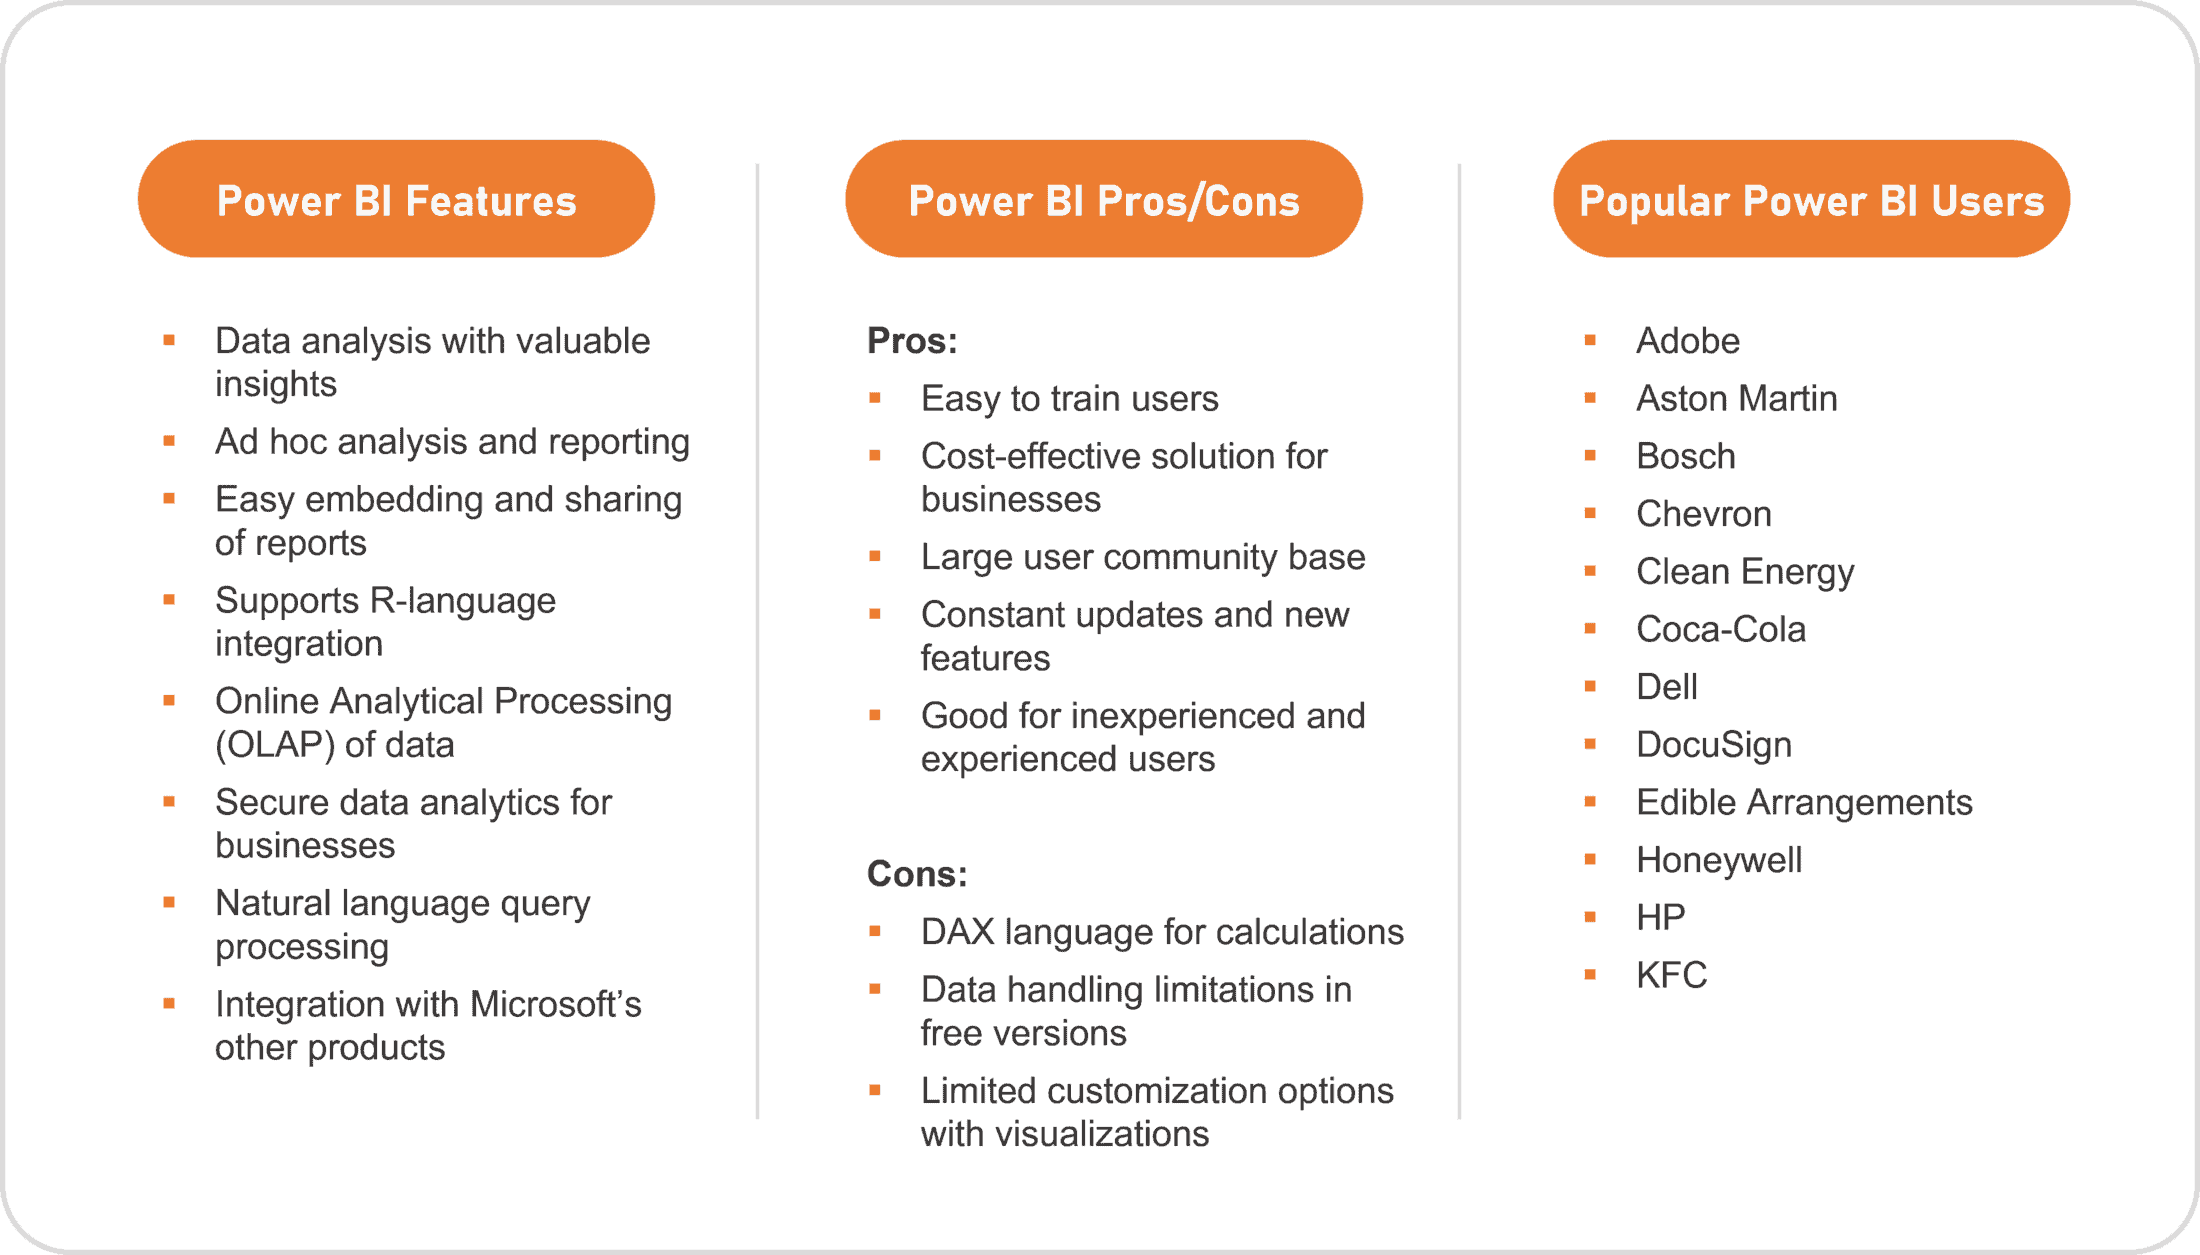
What is Power BI?
Launched by the technology giant Microsoft in 2013, Power BI is an interactive and easy-to-use data visualization product from Microsoft’s Power Platform suite. Power BI is primarily focused on self-service and enterprise business intelligence.
Products Offered by Power BI:
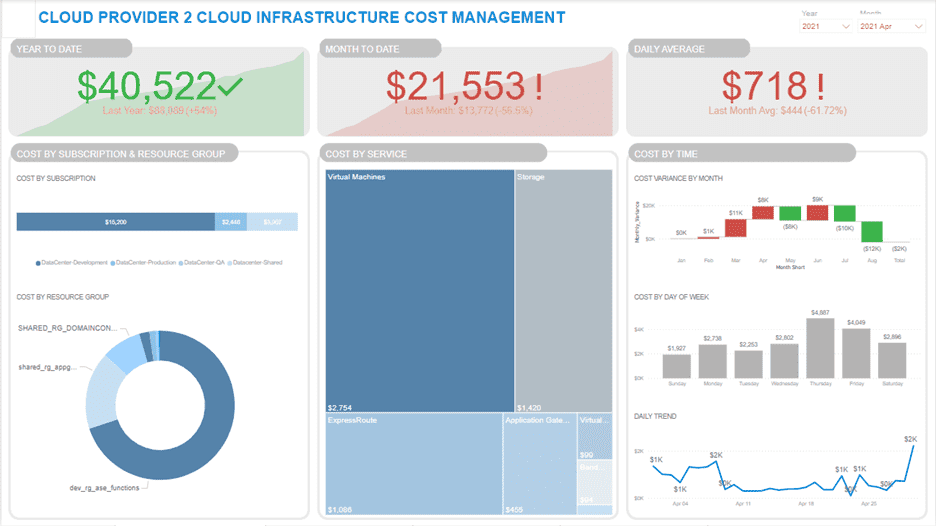
Sample Power BI Dashboard:
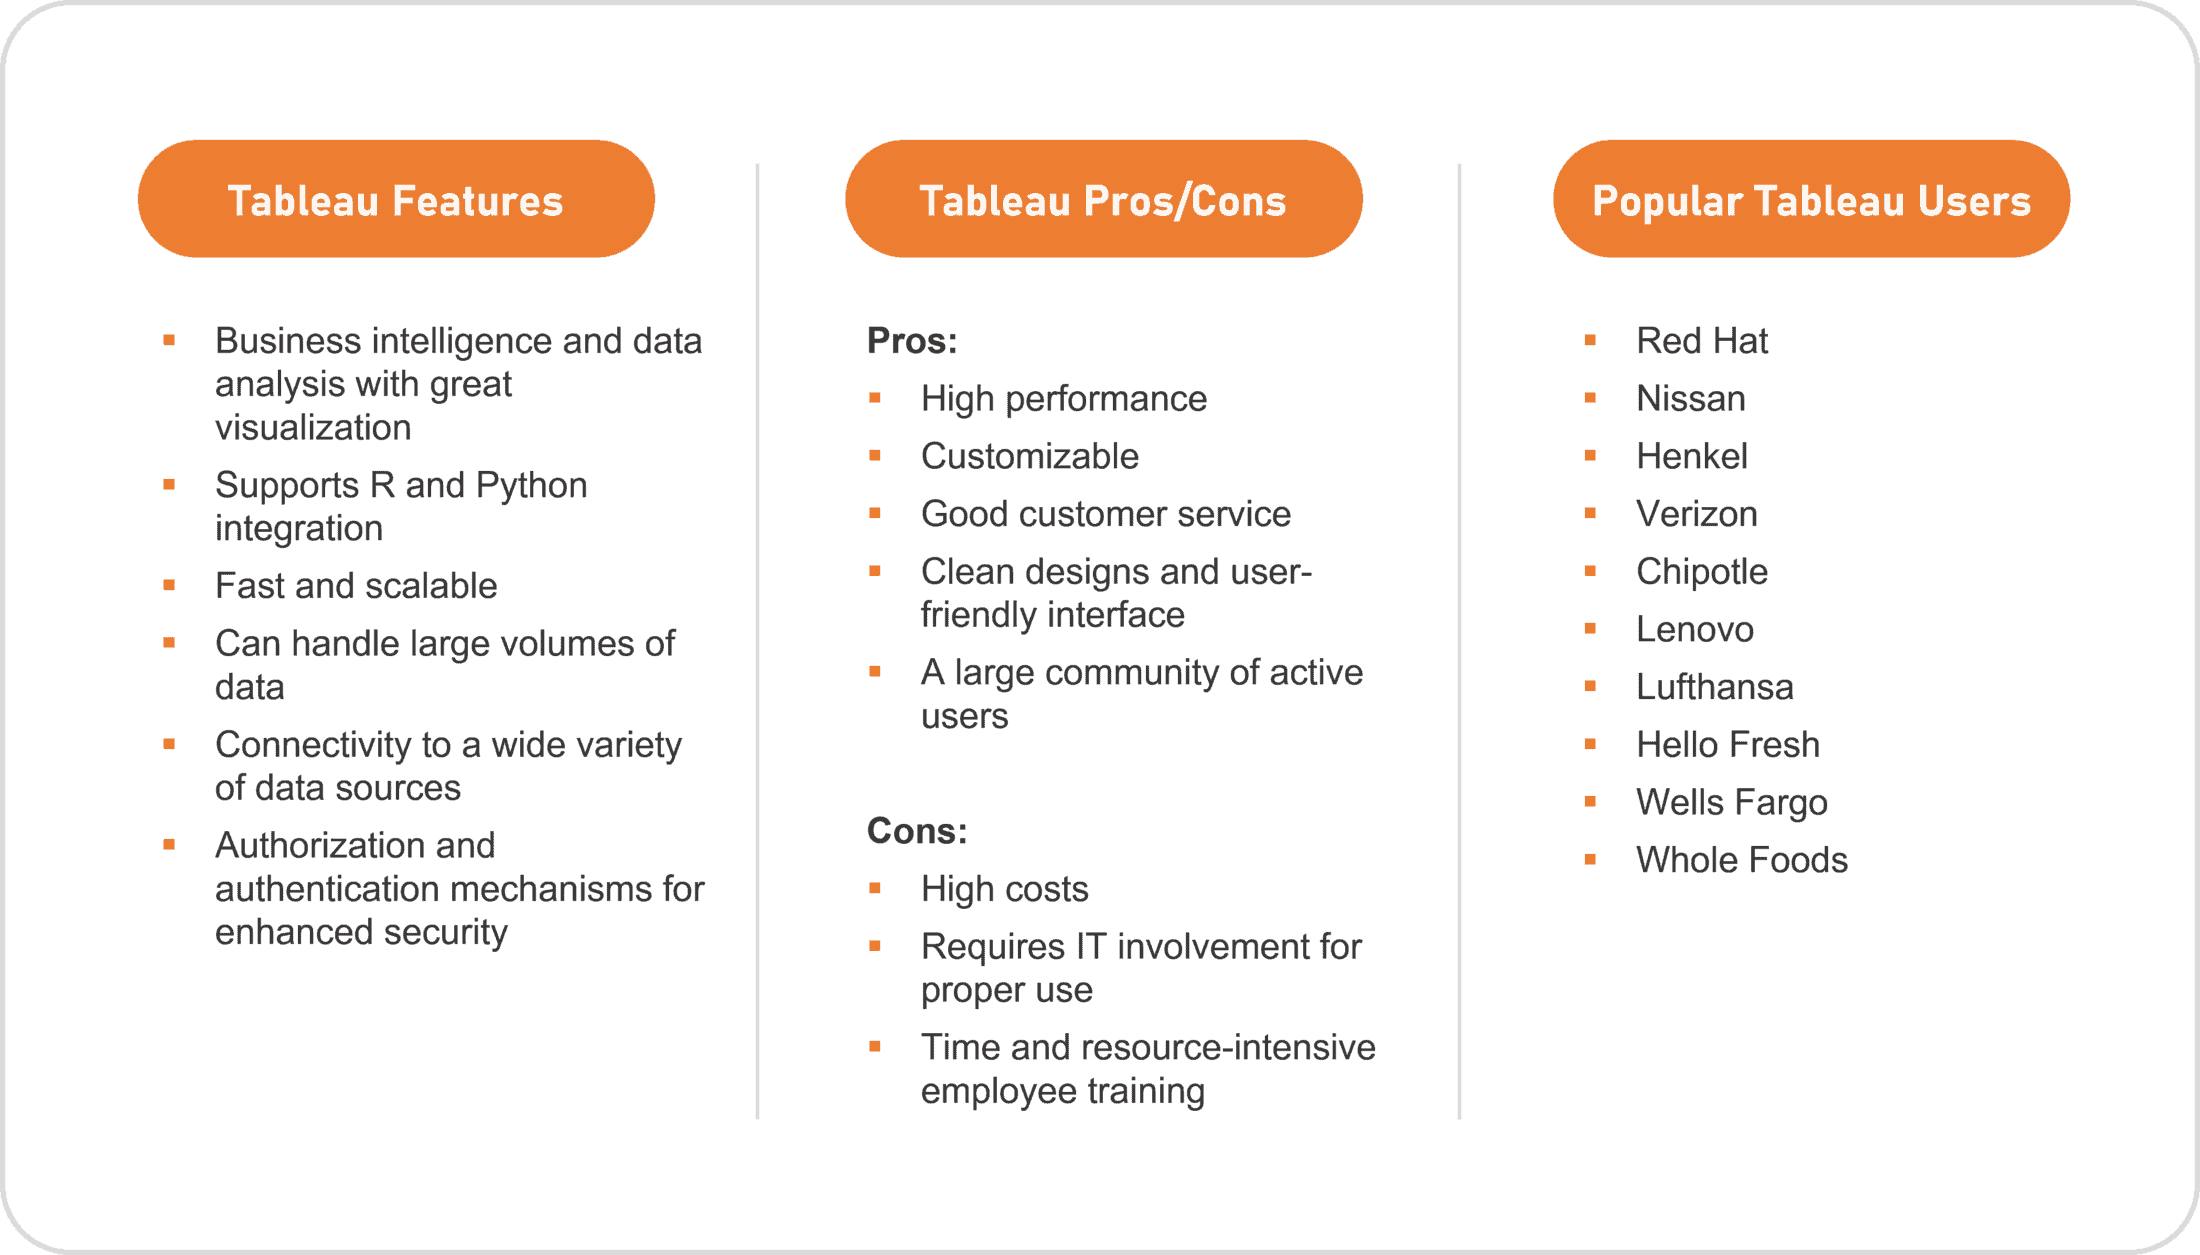
What is Tableau?
Tableau is a powerful data visualization tool, originally developed in 2003 and later acquired by Salesforce in 2019. It can analyze large amounts of raw data that can be understood by professionals at all levels in an organization.
Products Offered by Tableau:
Sample Tableau Dashboard:

The Road to Choosing the Right Tool is Not Straightforward
Of course, the road to finding the best technology between Power BI and Tableau is not a straightforward one, but we are here to help guide you through some of the key criteria and assist you in carefully choosing the right one.
Learning and Adaptability by Business Users
Tableau specializes in rich visualizations that can perform complex tasks with quick drag-and-drop functionalities. It also provides some additional features as part of the package but may require some help from IT to learn and implement them. If your business units rely heavily on the IT department for their analytics needs, then leveraging Tableau can help you uncover some crucial business metrics.
Power BI is very easy to learn and pick up if your business users are already comfortable using other Microsoft business tools. If your company is striving for self-service business intelligence, then learning and adapting to Power BI will be quick and easy with some help from IT for governance. Additionally, Power BI offers many complex features and functionalities that can be utilized for enterprise-wide high-level dashboards by your IT team.
Data Analysis and Visualization Capabilities
Power BI provides all the visualizations business users are ever going to need with an option of importing custom visuals from its marketplace. It also provides machine learning capabilities with the availability of Azure Machine Learning Services.
Tableau gives an enhanced UI experience to its users with dynamic tool-tip and web page object functionality. The visualizations are very powerful and can represent complex data. Users can also create additional, custom visuals using the available choices.
Performance
This is related to how each of these tools can handle large amounts of data. If your organization has a massive amount of data that ranges into millions of rows or more, then Tableau is the right choice. This also means you will have to invest in an IT team that governs and controls the data.
Power BI cannot handle more than 10GB of data, and it’s a good solution for small to mid-sized companies. This also means that you can use it widely amongst all business units without needing to involve IT.
Connectivity with Data Sources
Business users need to connect to a multitude of data types including files, databases, and online applications. Both Power BI and Tableau support a variety of data source connections from native, to live, or to extracts.
While Tableau can connect to a wide range of servers and databases, Power BI allows other exclusive connectivity to the Microsoft ecosystem, including Azure and Power Apps services.
On-Premise or Cloud Deployment
Power BI offers both on-premise and cloud solutions to its users. While users can use the free Power BI Desktop version for self-service business intelligence, more complex tasks, such as streaming analytics, natural language processing, and alerts are available in the cloud version of Power BI.
Tableau also offers on-premise and cloud solutions to its clients with an upper hand on its on-premise deployments.
If your company has a large volume of data that’s stored on-premise, Tableau will give you the outcome that you are looking for. On the other hand, Microsoft’s offering of Azure cloud makes it a better solution if you are looking for cloud analytics.
Cost
It depends on how many users you have. Both platforms offer free options which are good for learning and training your employees. The free learning tools also help you get a feel for what suits your business better.
Power BI starts at $10 per user per month.
Tableau starts at $70 per user per month.
Additionally, it depends on how many applications, the combination of applications, and how many users are going to work in the system. Overall, Tableau tends to be more expensive than Power BI, but it comes with support for big data sets, the increased availability of different visualization, and some other options that Power BI doesn’t include. However, that increase in price for Tableau over Power BI is really for you to decide for your company based on what you want to do with your company’s data and if you need that extra functionality.
As you can see, there are many different pros and cons to both business intelligence tools. In the end, it really comes down to what your organization currently has data-wise and what you want to achieve with that data. Want to know our opinion on which one you should use and how you should implement it? Contact us! Our data experts are here to help you from start to finish.
Looking for more on data and analytics?
Explore more insights and expertise at smartbridge.com/data
Keep Reading: Intro to Advanced Analytics
There’s more to explore at Smartbridge.com!
Sign up to be notified when we publish articles, news, videos and more!
Other ways to
follow us: